Fig. 8
Download original image
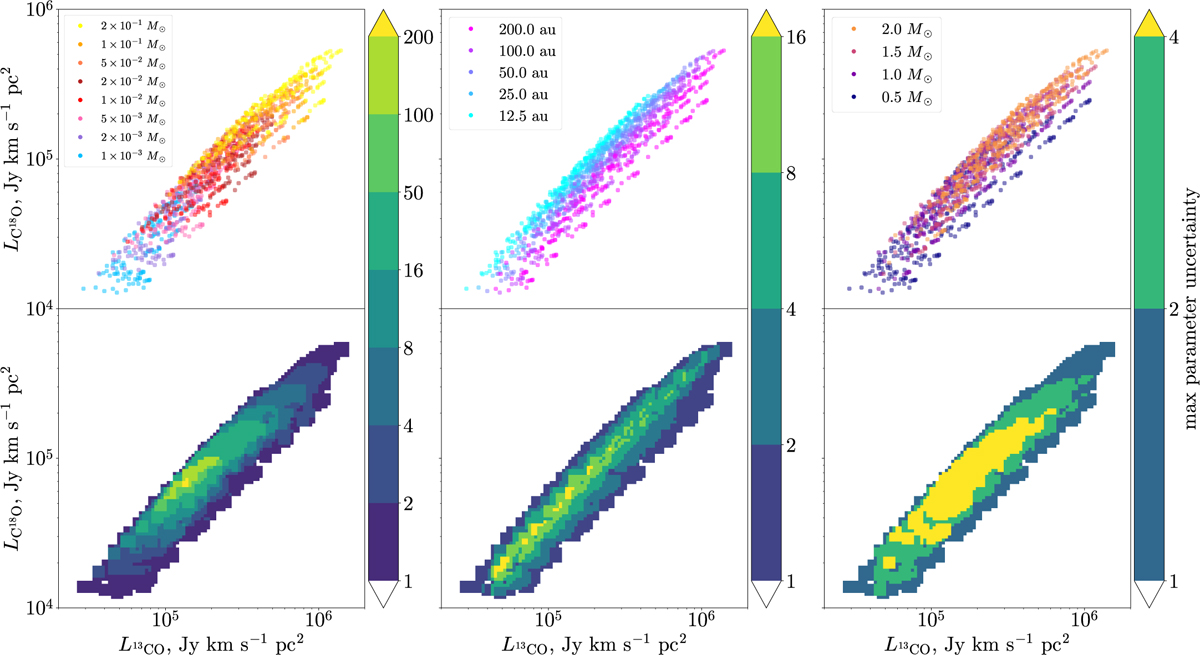
Luminosity diagrams for the C18O and 13CO lines in our models. Upper left: model fluxes are grouped by disk mass and contours outline the regions where models of corresponding mass reside. Upper middle: models are colored according to characteristic radius. Upper right: Models are colored according to stellar mass. Lower left: distribution of uncertainty in disk mass. Lower middle: uncertainty in characteristic radius. Lower right: uncertainty in stellar mass. Uncertainty here is defined as the ratio of maximum and minimum parameter value within 10% range of luminosities of the point on the diagram. White means there are no models nearby.
Current usage metrics show cumulative count of Article Views (full-text article views including HTML views, PDF and ePub downloads, according to the available data) and Abstracts Views on Vision4Press platform.
Data correspond to usage on the plateform after 2015. The current usage metrics is available 48-96 hours after online publication and is updated daily on week days.
Initial download of the metrics may take a while.