Fig. 10
Download original image
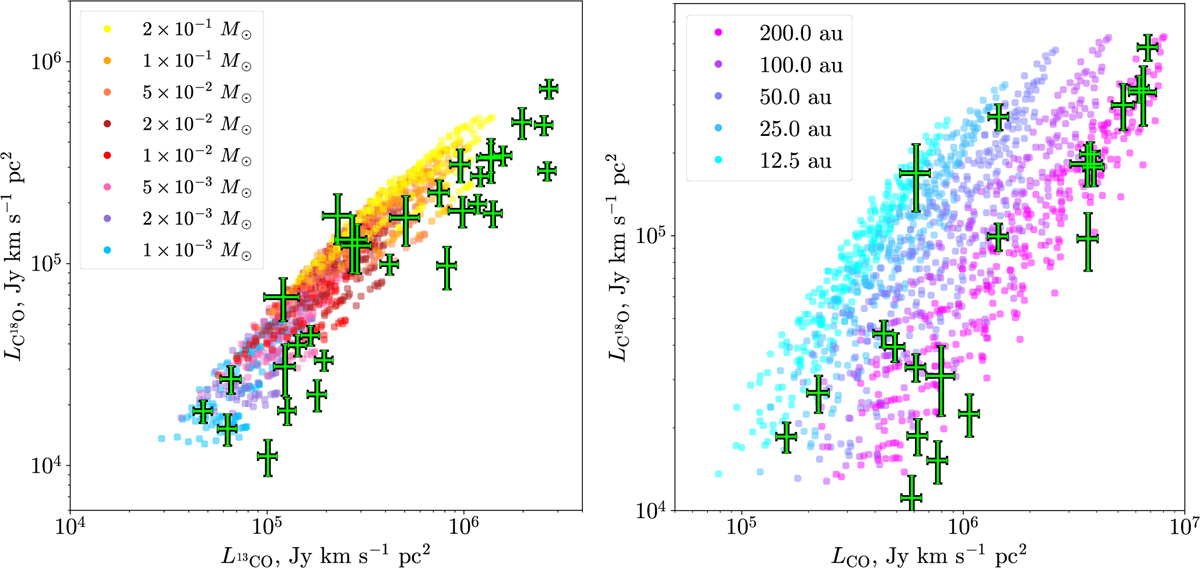
Left: luminosity diagram for the C18O and 13CO lines. Translucent points are results of this work with grain-surface chemistry network The points are colored according to the disk mass of the model. Markers with errorbars are observations compiled in Zwicky et al. (2024) and from Ansdell et al. (2016). Right: luminosity diagram in the C18O and CO lines. All points are results of this work with grain-surface chemistry network and colored according to the Rc. Markers with errorbars are observations compiled in Zwicky et al. (2024).
Current usage metrics show cumulative count of Article Views (full-text article views including HTML views, PDF and ePub downloads, according to the available data) and Abstracts Views on Vision4Press platform.
Data correspond to usage on the plateform after 2015. The current usage metrics is available 48-96 hours after online publication and is updated daily on week days.
Initial download of the metrics may take a while.