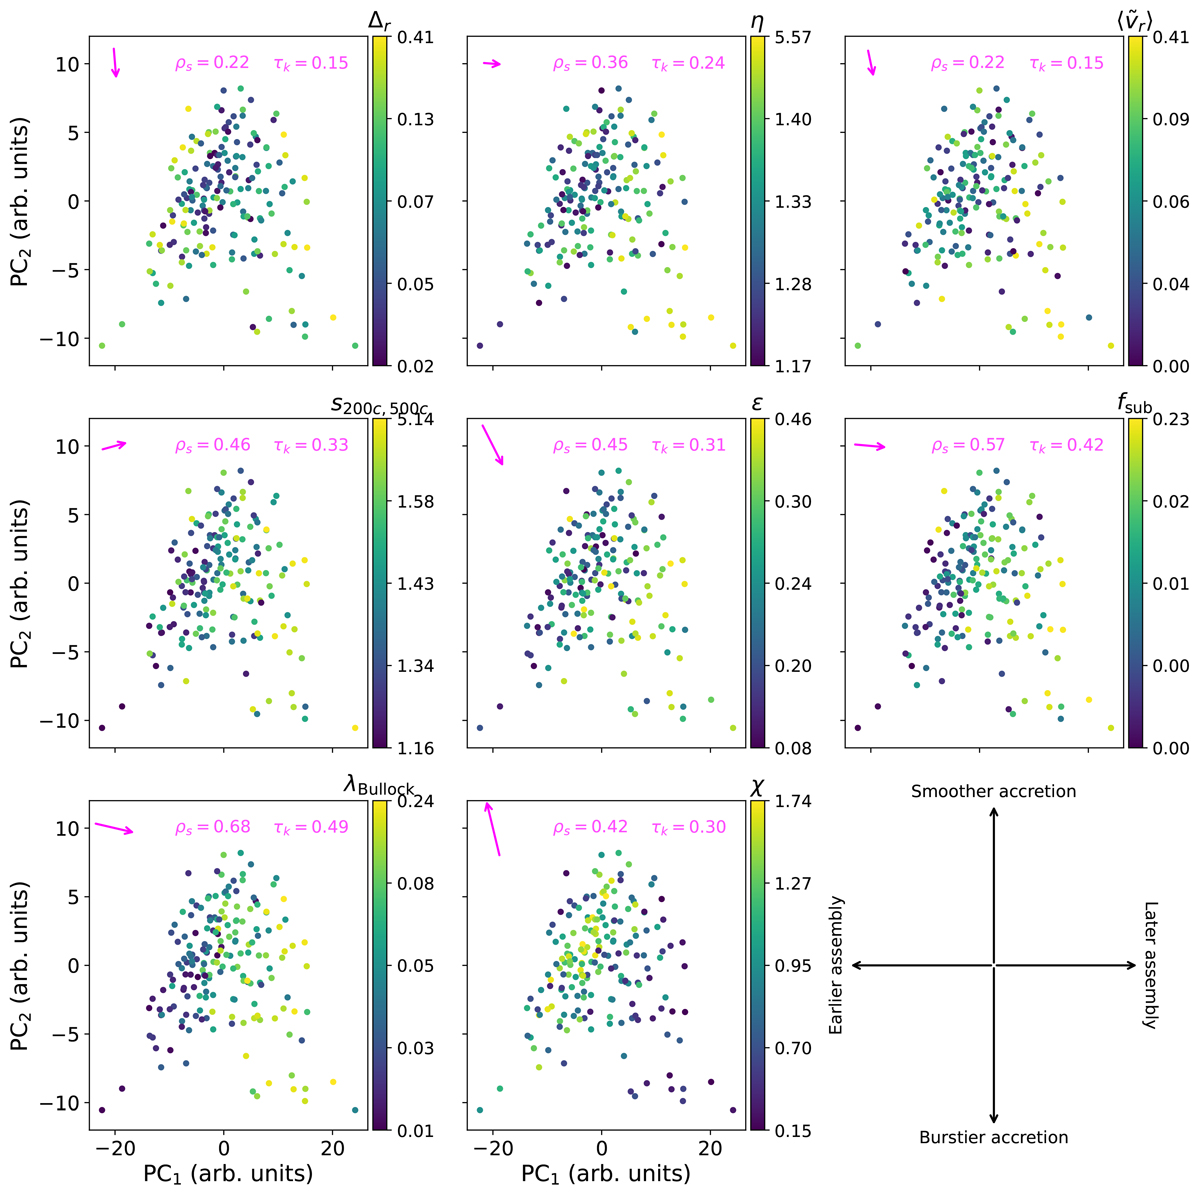
Fig. 9.
Download original image
Assembly histories for individual clusters (summarised in the PC1 − PC2 plane) colour-coded according to each of the assembly state indicators at z = 0. The colour bars are ordinal (i.e. linear in the ranked variable: e.g. the middle point of the colorbar corresponds to the median value). At the top of each panel, we indicate the direction of maximum correlation with the indicator, the Spearman rank correlation coefficient, and the Kendall rank correlation coefficient.
Current usage metrics show cumulative count of Article Views (full-text article views including HTML views, PDF and ePub downloads, according to the available data) and Abstracts Views on Vision4Press platform.
Data correspond to usage on the plateform after 2015. The current usage metrics is available 48-96 hours after online publication and is updated daily on week days.
Initial download of the metrics may take a while.