Fig. 7.
Download original image
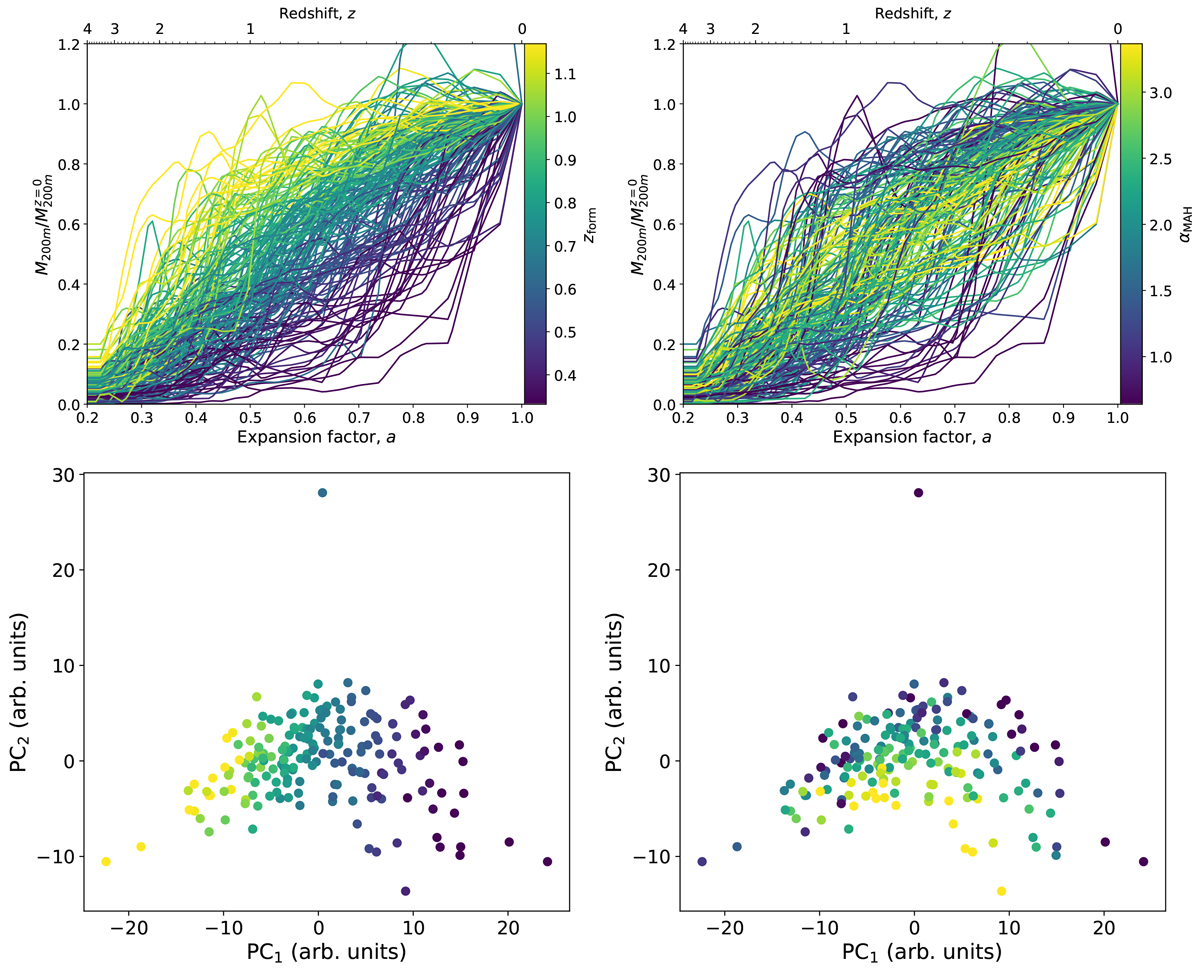
Parametrisation of the MAHs. The two top panels present the assembly histories of the whole sample, colour-coded according to the formation redshift zform (left) and the episodicity parameter αMAH (right-hand side panel). The two bottom panels describe the distribution of these parameters in the {PC1, PC2} space, accounting for the maximum variance with two linearly uncorrelated components. The colour coding of the dots is the same as represented in their respective top panels.
Current usage metrics show cumulative count of Article Views (full-text article views including HTML views, PDF and ePub downloads, according to the available data) and Abstracts Views on Vision4Press platform.
Data correspond to usage on the plateform after 2015. The current usage metrics is available 48-96 hours after online publication and is updated daily on week days.
Initial download of the metrics may take a while.