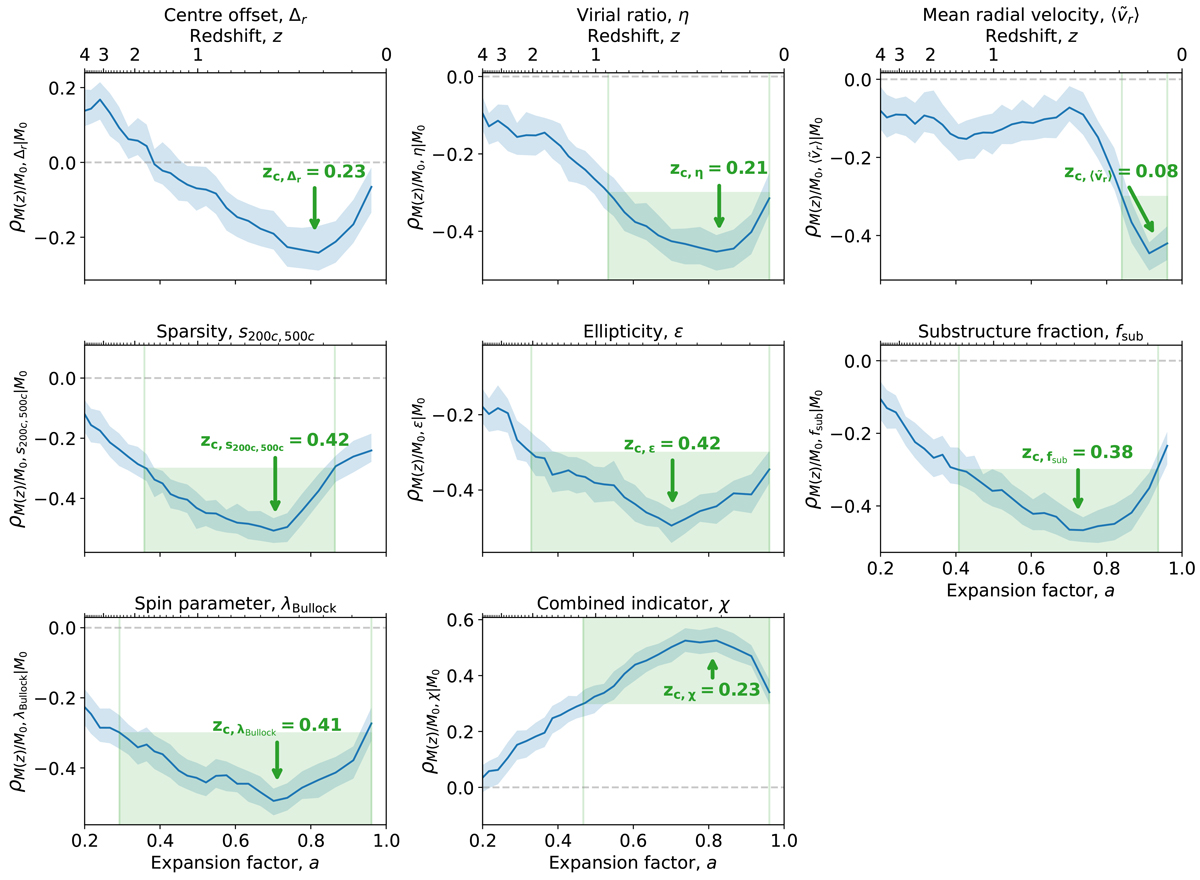
Fig. 4.
Download original image
Constraining power of the z0 = 0 assembly state indicators on the MAHs. Each panel shows the Spearman rank correlations between the MAH curves and a z0 = 0 assembly state indicator. The absolute magnitude of the curve at each z can be read as the fraction of the scatter on the ranking of M(z)/M0 that can be explained by the corresponding parameter at z0 = 0. The green regions indicate the redshift intervals where this correlation exceeds 0.3 in magnitude, with the green, vertical lines delimiting the interval to ease the visualisation. The horizontal, grey, dashed line marks null correlation. The arrows indicate the redshift at which this correlation is maximal, zc, X.
Current usage metrics show cumulative count of Article Views (full-text article views including HTML views, PDF and ePub downloads, according to the available data) and Abstracts Views on Vision4Press platform.
Data correspond to usage on the plateform after 2015. The current usage metrics is available 48-96 hours after online publication and is updated daily on week days.
Initial download of the metrics may take a while.