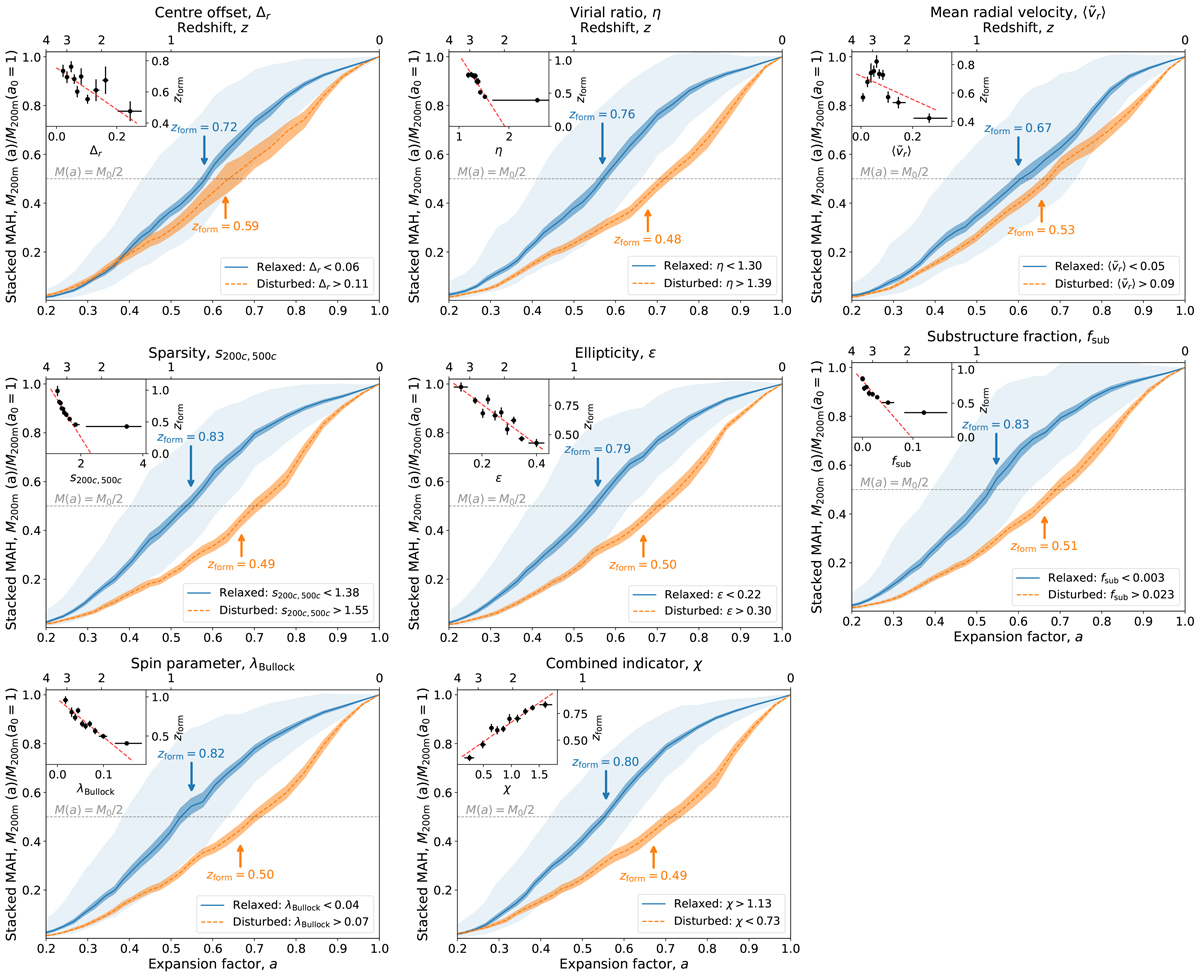
Fig. 3.
Download original image
Effects of selecting halos based on their assembly state indicators at z = 0 on their full MAHs. Blue solid lines show the most relaxed third of the halo population at z = 0 according to each parameter, specified in the sub-plot title. Orange dashed lines refer to the most disturbed third. Dark and light contours indicate uncertainty on the mean and population scatter, respectively. The insets indicate the dependence of zform with the corresponding parameter, with a linear fit as the red, dashed line.
Current usage metrics show cumulative count of Article Views (full-text article views including HTML views, PDF and ePub downloads, according to the available data) and Abstracts Views on Vision4Press platform.
Data correspond to usage on the plateform after 2015. The current usage metrics is available 48-96 hours after online publication and is updated daily on week days.
Initial download of the metrics may take a while.