Fig. 2.

Download original image
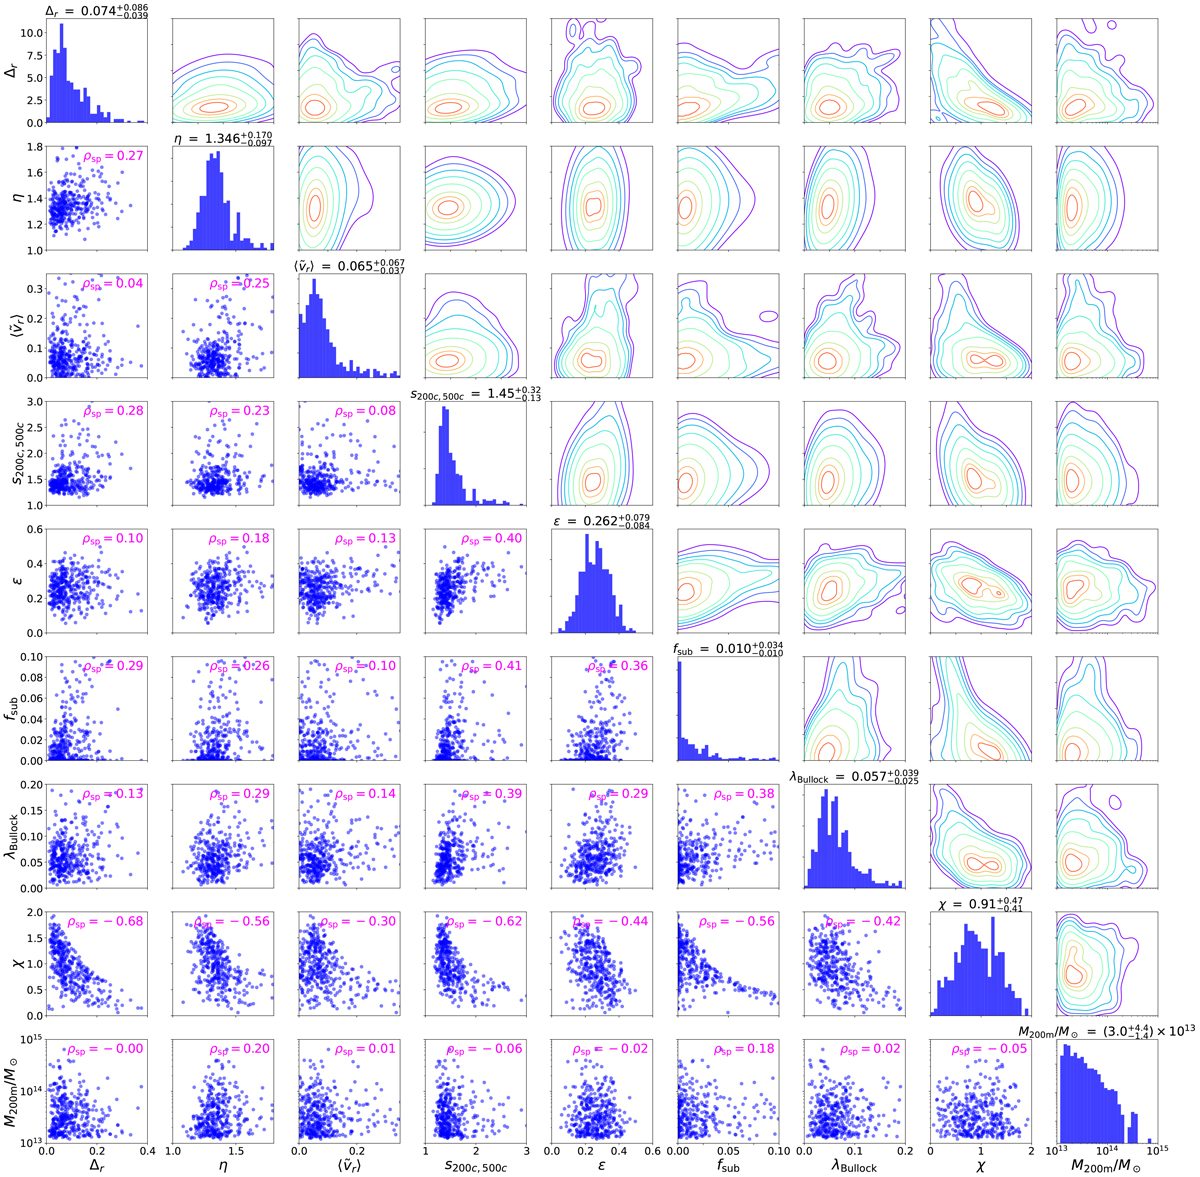
Corner plot showing the univariate and bivariate distribution of the assembly state indicators and mass at R200m, all measured at z = 0. Along the diagonal, each panel presents the distribution of one variable, with the text in the top indicating the median value and (16, 84) percentiles. The sub-diagonal terms are scatter plots of the pair of variables indicated by the respective row and column. The text in magenta within each off-diagonal panel indicates the Spearman rank correlation coefficient between the corresponding pair of variables. The panels above the diagonal represent the same information as contours, for better visualisation in the densest parts.
Current usage metrics show cumulative count of Article Views (full-text article views including HTML views, PDF and ePub downloads, according to the available data) and Abstracts Views on Vision4Press platform.
Data correspond to usage on the plateform after 2015. The current usage metrics is available 48-96 hours after online publication and is updated daily on week days.
Initial download of the metrics may take a while.


