Open Access
Fig. B.3.
Download original image
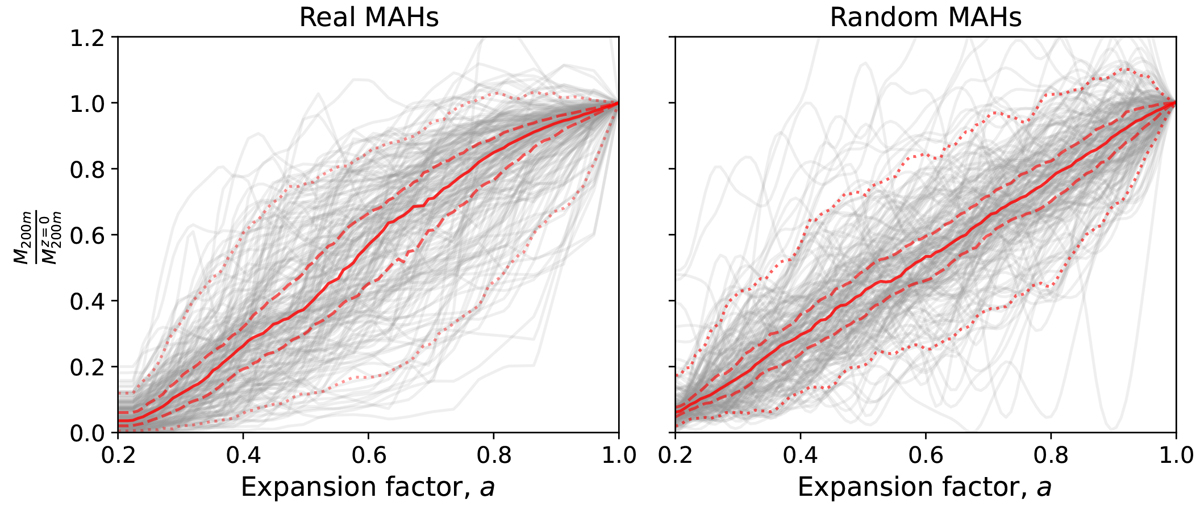
Comparison between the actual MAHs in our sample (left-hand side panel) and the mock ones generated to investigate the origin of their PCA (right-hand side panel). Here, gray lines are individual MAHs. The solid, red line is the mean MAH, while the dashed (dotted) lines indicate 32 − 68 (5 − 95) percentiles.
Current usage metrics show cumulative count of Article Views (full-text article views including HTML views, PDF and ePub downloads, according to the available data) and Abstracts Views on Vision4Press platform.
Data correspond to usage on the plateform after 2015. The current usage metrics is available 48-96 hours after online publication and is updated daily on week days.
Initial download of the metrics may take a while.