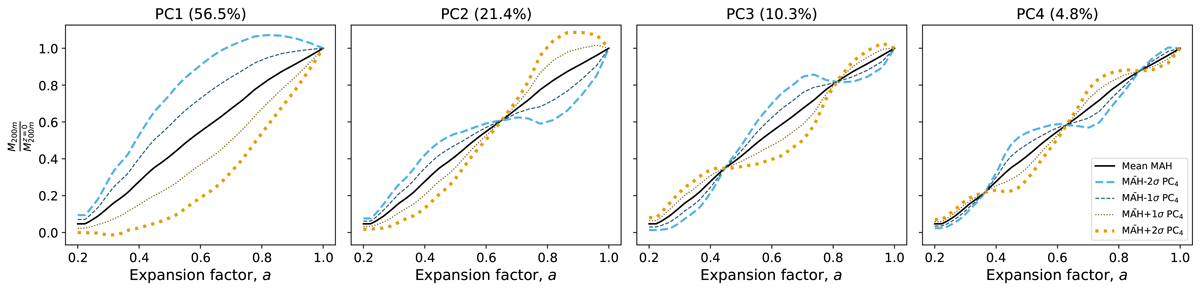
Fig. B.1.
Download original image
First four principal components of our MAHs (from left to right, in decreasing order of explained variance, stated in the title of each panel). Within each panel, the black line represents the mean MAH of the sample. The different additional curves correspond to ±1σ and ±2σ of the values of the corresponding principal component, reflecting how each component is producing changes in the MAHs of our sample.
Current usage metrics show cumulative count of Article Views (full-text article views including HTML views, PDF and ePub downloads, according to the available data) and Abstracts Views on Vision4Press platform.
Data correspond to usage on the plateform after 2015. The current usage metrics is available 48-96 hours after online publication and is updated daily on week days.
Initial download of the metrics may take a while.