Fig. 10.
Download original image
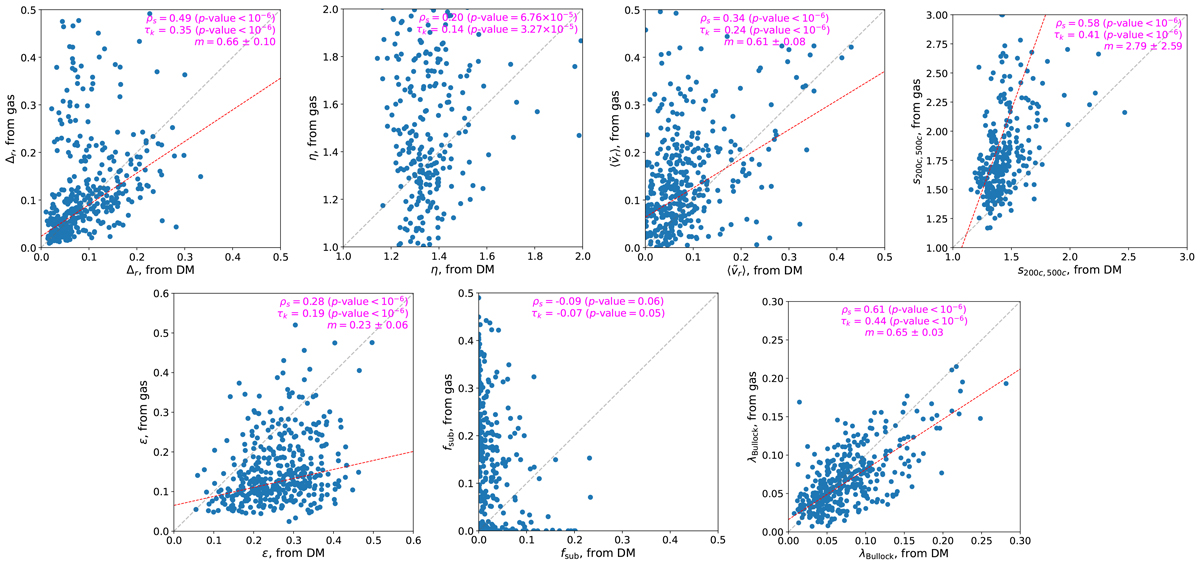
Correspondence between the assembly state indicators measured from the DM distribution (horizontal axes) and from the ICM distribution (vertical axes), at z = 0. Each panel corresponds to a different parameter. Within each panel, each dot corresponds to a cluster or group; the dashed, gray line is the identity relation (Xgas = XDM); and the dashed red line is a least-squares linear fit, whose slope (m) is given at the top of each panel. Also the Spearman and Kendall rank correlation magnitudes, and their p-values, are given there.
Current usage metrics show cumulative count of Article Views (full-text article views including HTML views, PDF and ePub downloads, according to the available data) and Abstracts Views on Vision4Press platform.
Data correspond to usage on the plateform after 2015. The current usage metrics is available 48-96 hours after online publication and is updated daily on week days.
Initial download of the metrics may take a while.