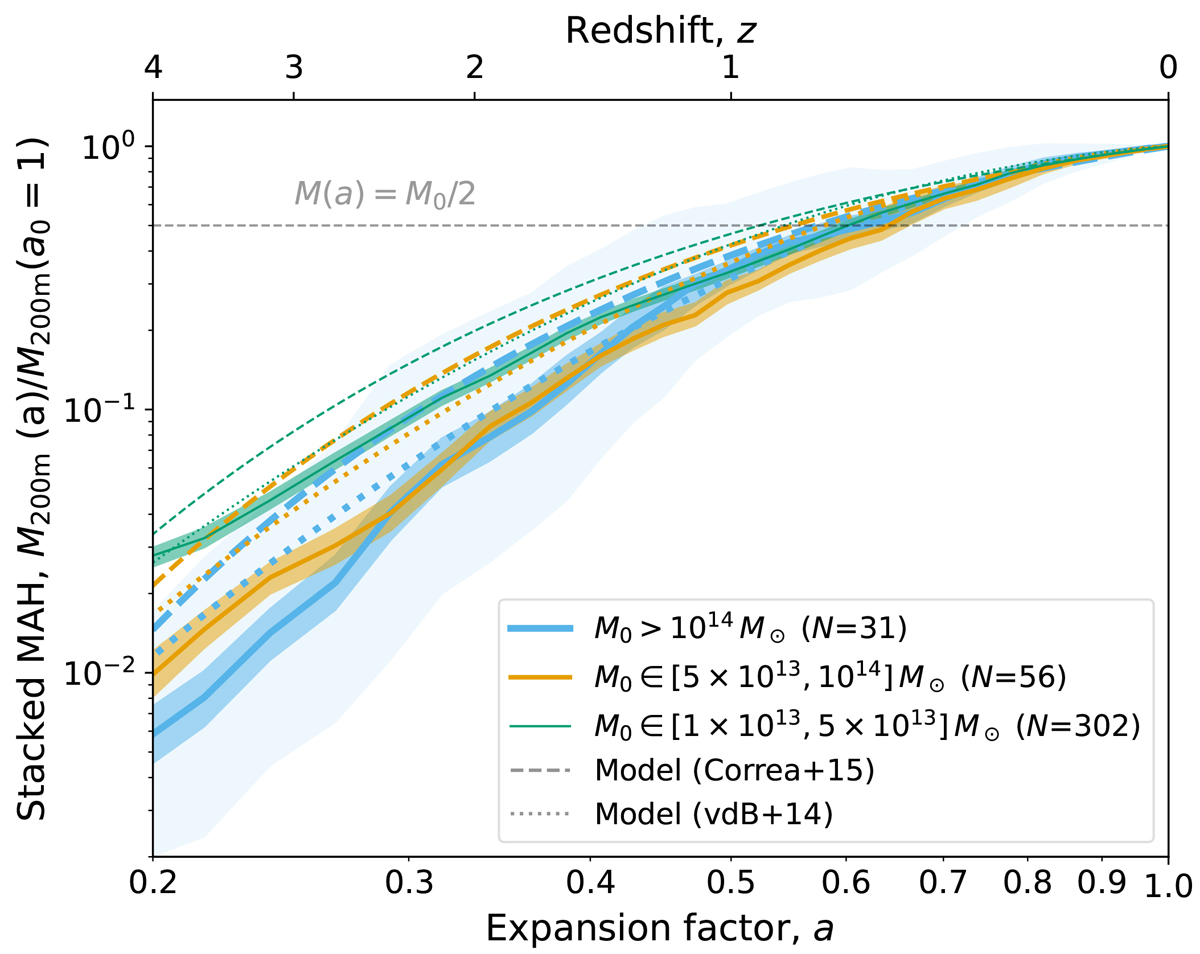
Fig. 1.
Download original image
Stacked mass assembly histories (MAHs) in three mass sub-samples, corresponding to galaxy clusters (light blue, thicker lines), high-mass groups (orange), and low-mass groups (turquoise, thinner lines). Dark shaded regions indicate the 1σ uncertainty around each mean MAH. Light shaded regions indicate the population standard deviation (just shown for the galaxy clusters sub-sample for clarity). Dashed (dotted) lines show the MAHs expected for each mass range according to the analytic (semi-analytic) model by Correa et al. (2015) (van den Bosch et al. 2014).
Current usage metrics show cumulative count of Article Views (full-text article views including HTML views, PDF and ePub downloads, according to the available data) and Abstracts Views on Vision4Press platform.
Data correspond to usage on the plateform after 2015. The current usage metrics is available 48-96 hours after online publication and is updated daily on week days.
Initial download of the metrics may take a while.