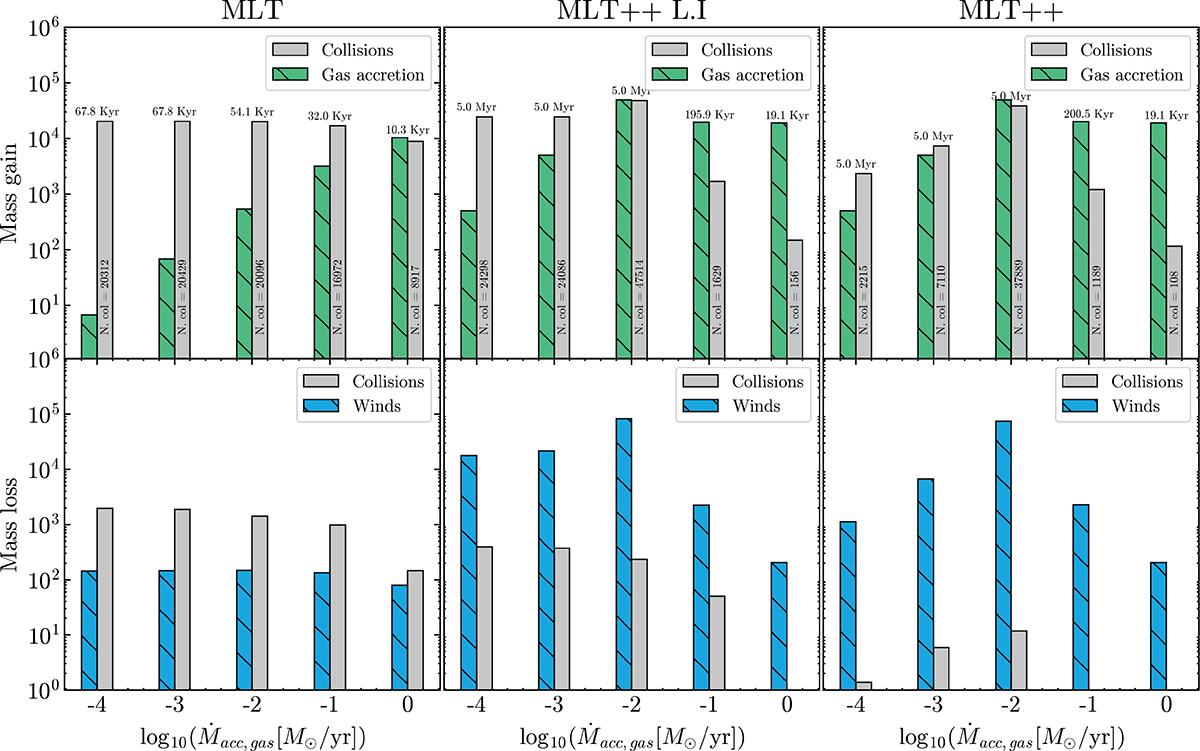
Fig. 5.
Download original image
Top: Respective contributions of gas accretion and collisions to the total mass gain of the 1000 M⊙ target for different gas accretion rates in the Monte Carlo simulations (mean values). Bottom: Respective contributions of winds and collision-induced mass loss to the total mass lost for the same simulations. The time above the bars shows the mean time to the end of the simulations, and the mean number of collisions is displayed in the corresponding bar chart.
Current usage metrics show cumulative count of Article Views (full-text article views including HTML views, PDF and ePub downloads, according to the available data) and Abstracts Views on Vision4Press platform.
Data correspond to usage on the plateform after 2015. The current usage metrics is available 48-96 hours after online publication and is updated daily on week days.
Initial download of the metrics may take a while.