Fig. 4.
Download original image
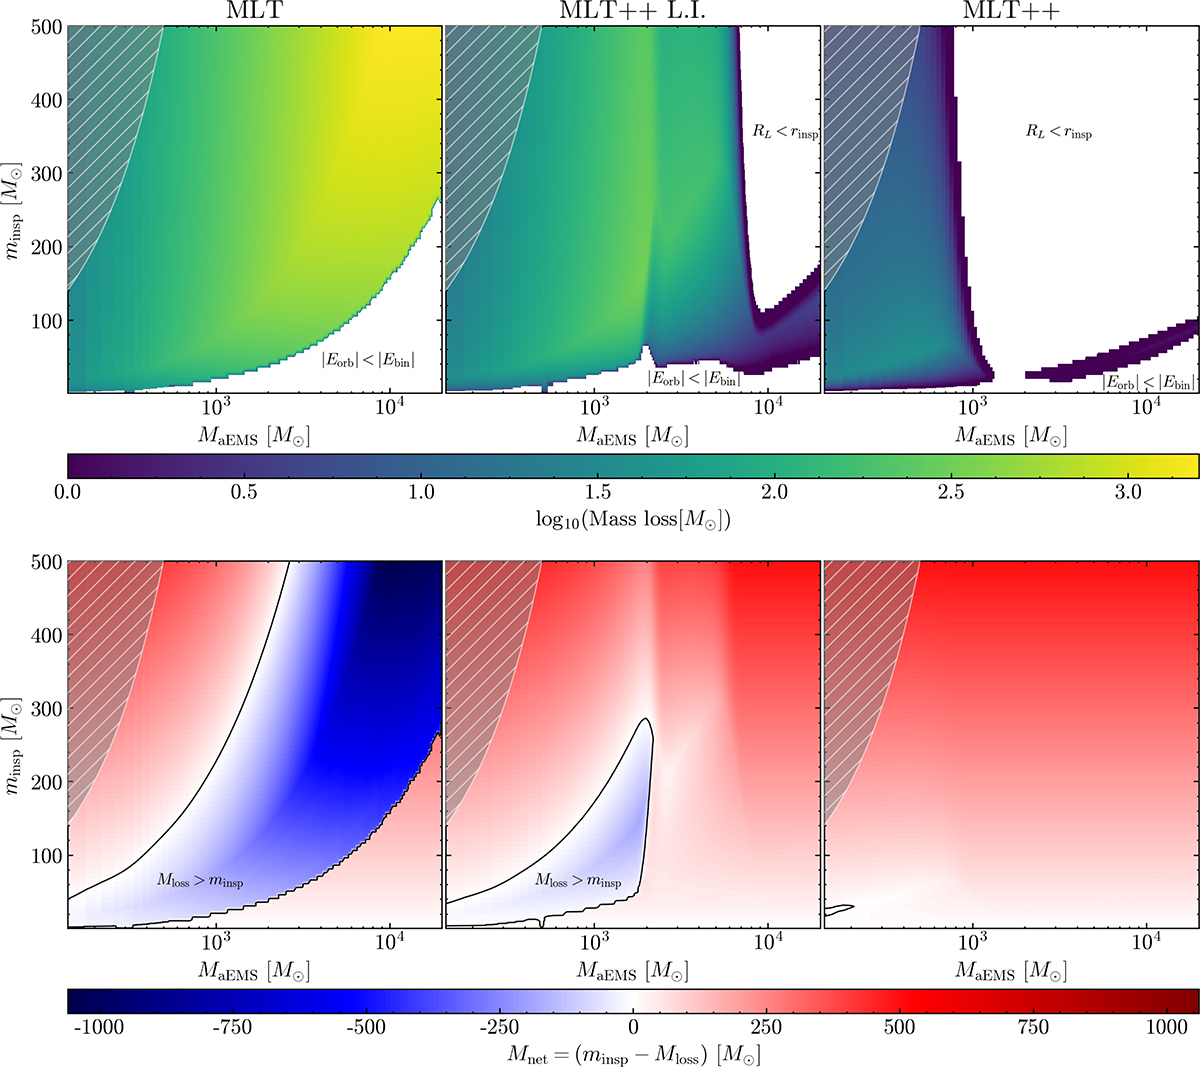
Color maps of the mass loss (upper row) and net mass change (lower row) due to a collision with inspiraling stars with minsp between 0.1 and 500 M⊙ as a function of the mass of the target stars with MaEMS between 140 and 20 000 M⊙. The three panels in each row correspond to the different convection treatments, as indicated. The hatched area delineates the region where our analytical approach is not applicable, namely, minsp/MaEMS≥1. In the bottom row the black lines indicate the change in the sign of Mnet.
Current usage metrics show cumulative count of Article Views (full-text article views including HTML views, PDF and ePub downloads, according to the available data) and Abstracts Views on Vision4Press platform.
Data correspond to usage on the plateform after 2015. The current usage metrics is available 48-96 hours after online publication and is updated daily on week days.
Initial download of the metrics may take a while.