Fig. 3.
Download original image
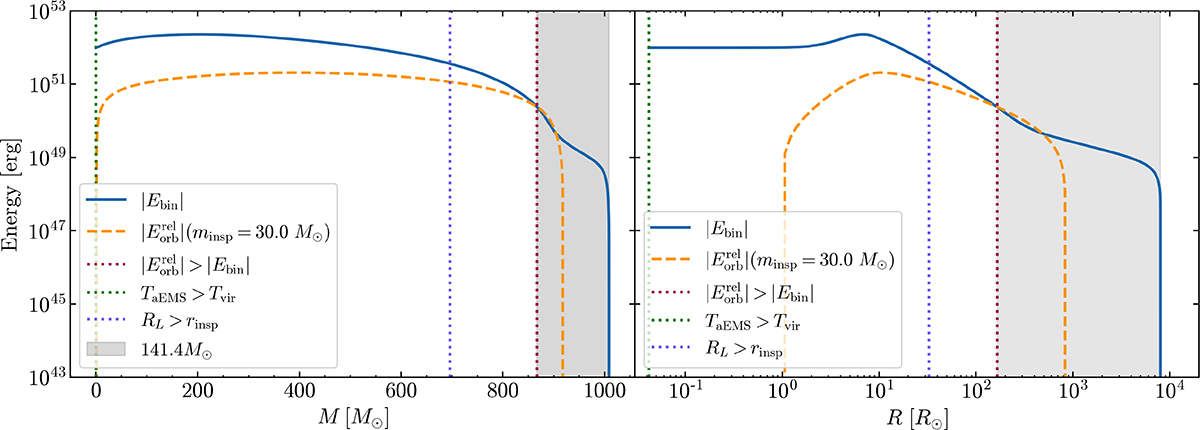
Comparison between |Ebin| within an aEMS of 1000 M⊙ and the orbital energy ![]() of a 30 M⊙ inspiraling star (blue full and orange dotted lines respectively), for models computed with MLT and [Fe/H] = −2.00 dex, with the abscissa in mass and radius in the left and right panels, respectively. The red-dotted lines show the coordinates where
of a 30 M⊙ inspiraling star (blue full and orange dotted lines respectively), for models computed with MLT and [Fe/H] = −2.00 dex, with the abscissa in mass and radius in the left and right panels, respectively. The red-dotted lines show the coordinates where ![]() is higher than |Ebin|. The green-dotted lines represent the points where the local temperature of the aEMS exceeds the virial temperature of the inspiraling star. The dotted-purple lines represent the points where the radius of the inspiraling star fills the Roche lobe.
is higher than |Ebin|. The green-dotted lines represent the points where the local temperature of the aEMS exceeds the virial temperature of the inspiraling star. The dotted-purple lines represent the points where the radius of the inspiraling star fills the Roche lobe.
Current usage metrics show cumulative count of Article Views (full-text article views including HTML views, PDF and ePub downloads, according to the available data) and Abstracts Views on Vision4Press platform.
Data correspond to usage on the plateform after 2015. The current usage metrics is available 48-96 hours after online publication and is updated daily on week days.
Initial download of the metrics may take a while.