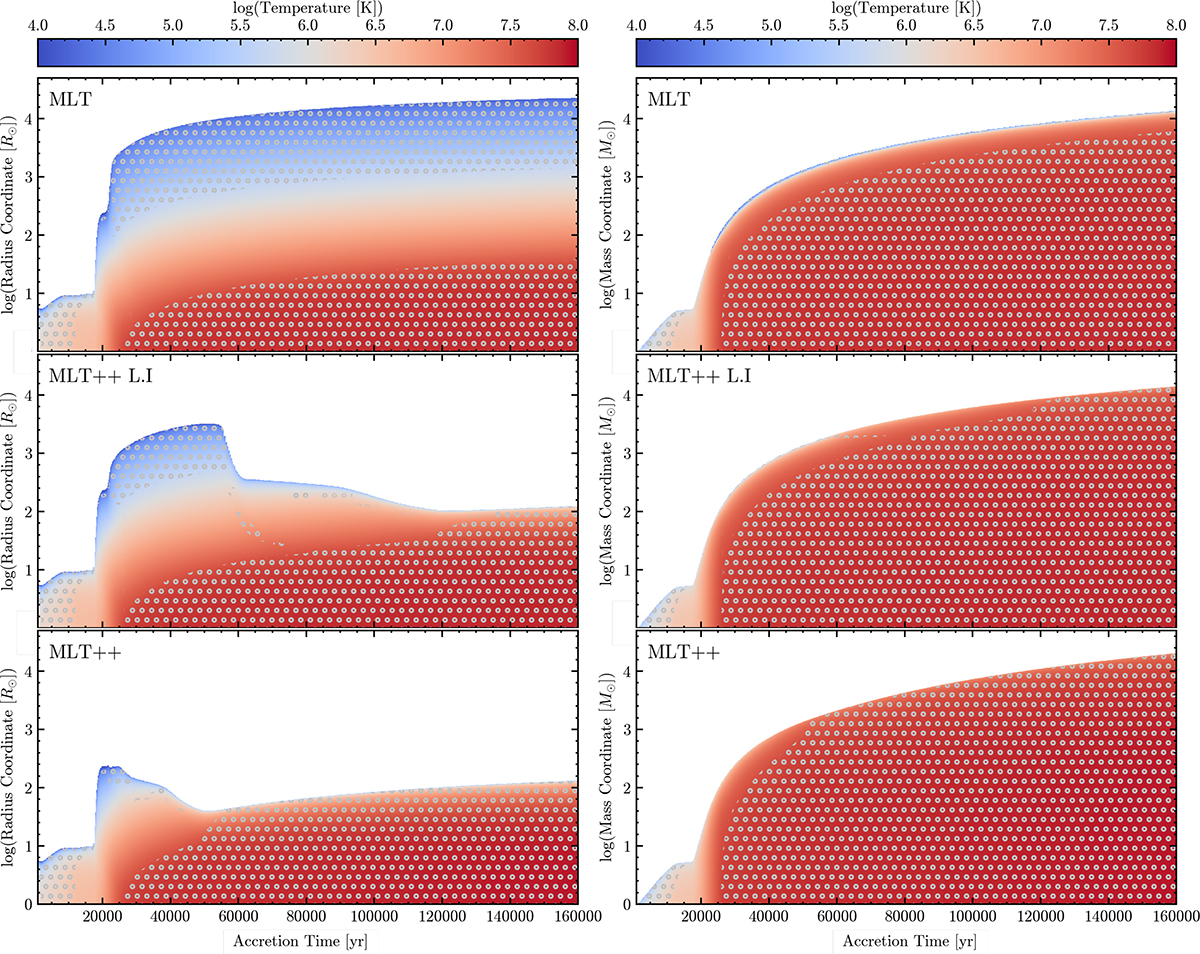
Fig. 2.
Download original image
Kippenhahn diagrams in radius and mass coordinates (left and right respectively) showing the evolution of the internal structure of the accreting models with [Fe/H] = −2 dex as in Fig. 1 for MLT, MLT++L.I., and MLT++ (from top to bottom). The x-axis is the time since the beginning of accretion on the 0.7 M⊙ seed. The color maps show the temperature profiles. Areas highlighted with gray dots denote convective regions.
Current usage metrics show cumulative count of Article Views (full-text article views including HTML views, PDF and ePub downloads, according to the available data) and Abstracts Views on Vision4Press platform.
Data correspond to usage on the plateform after 2015. The current usage metrics is available 48-96 hours after online publication and is updated daily on week days.
Initial download of the metrics may take a while.