Fig. 6.
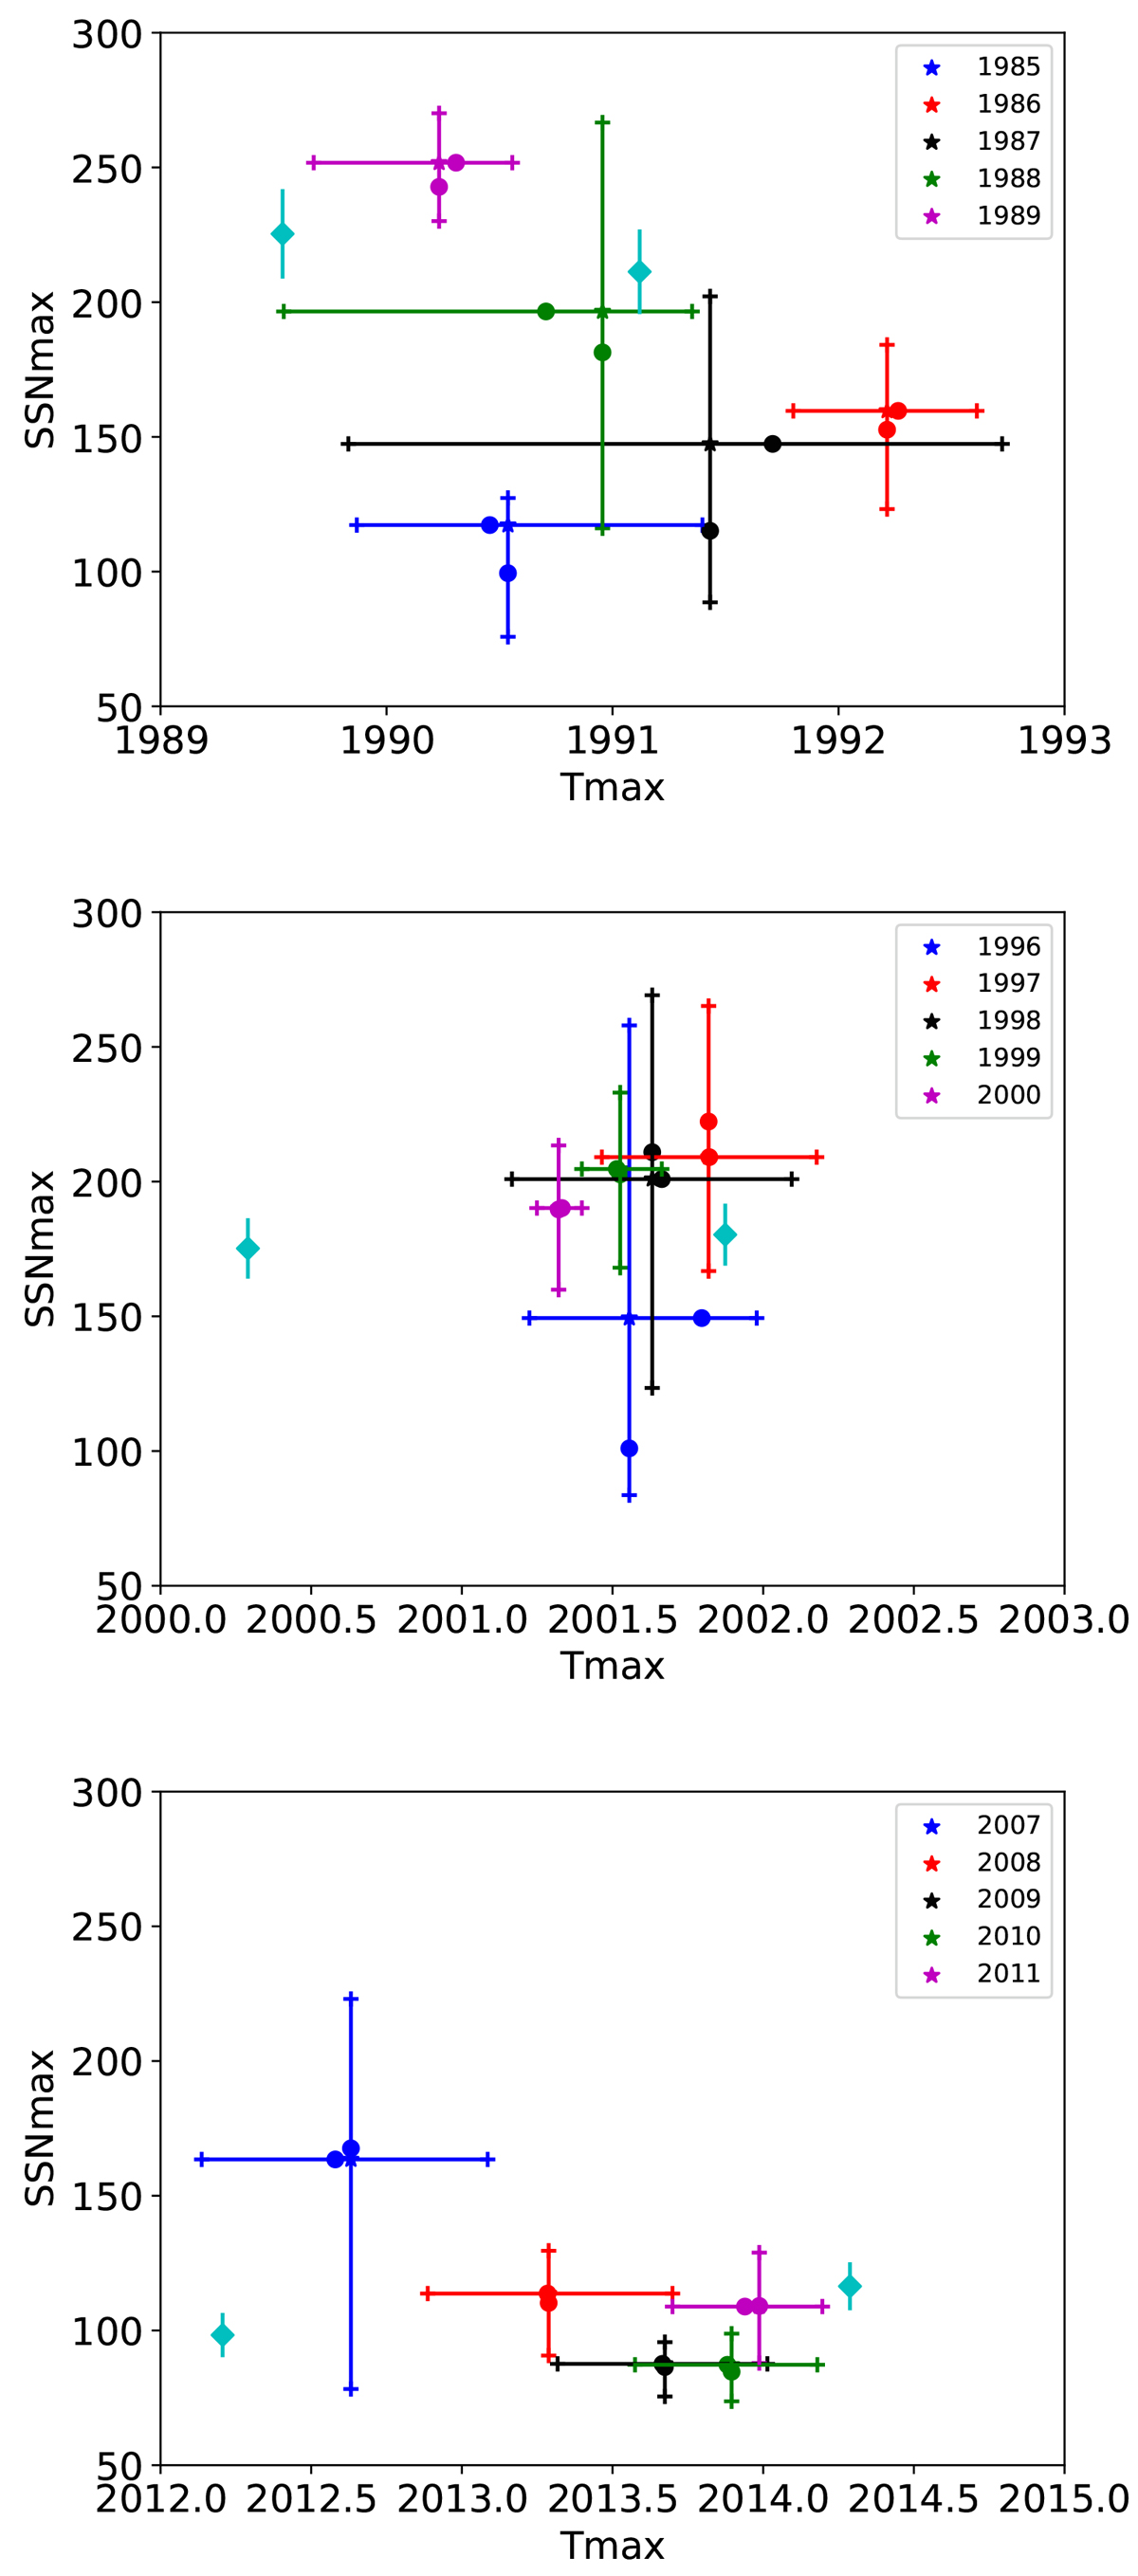
Download original image
Summary of the predicted time and sunspot number at maximum for cycles 22 (upper panel), 23 (mid panel) and 24 (lower panel) predicted from different phases of the previous cycle. The error bars are taken between the first and third quartiles of the distributions of tmax and SSNmax given in Table C.1. The second quartiles (i.e., median values) are indicated as dots and mean values as stars located at the intersection of the error bars. The cyan dots indicate the true values of the maximum with error bars on the sunspot number. For all cycles, two cyan dots are present, representing the two peaks of similar amplitude in the different cycles, visible on the 13 month smoothed sunspot number (red curves of Figs. 5, C.1, and C.2).
Current usage metrics show cumulative count of Article Views (full-text article views including HTML views, PDF and ePub downloads, according to the available data) and Abstracts Views on Vision4Press platform.
Data correspond to usage on the plateform after 2015. The current usage metrics is available 48-96 hours after online publication and is updated daily on week days.
Initial download of the metrics may take a while.