Fig. 4.
Download original image
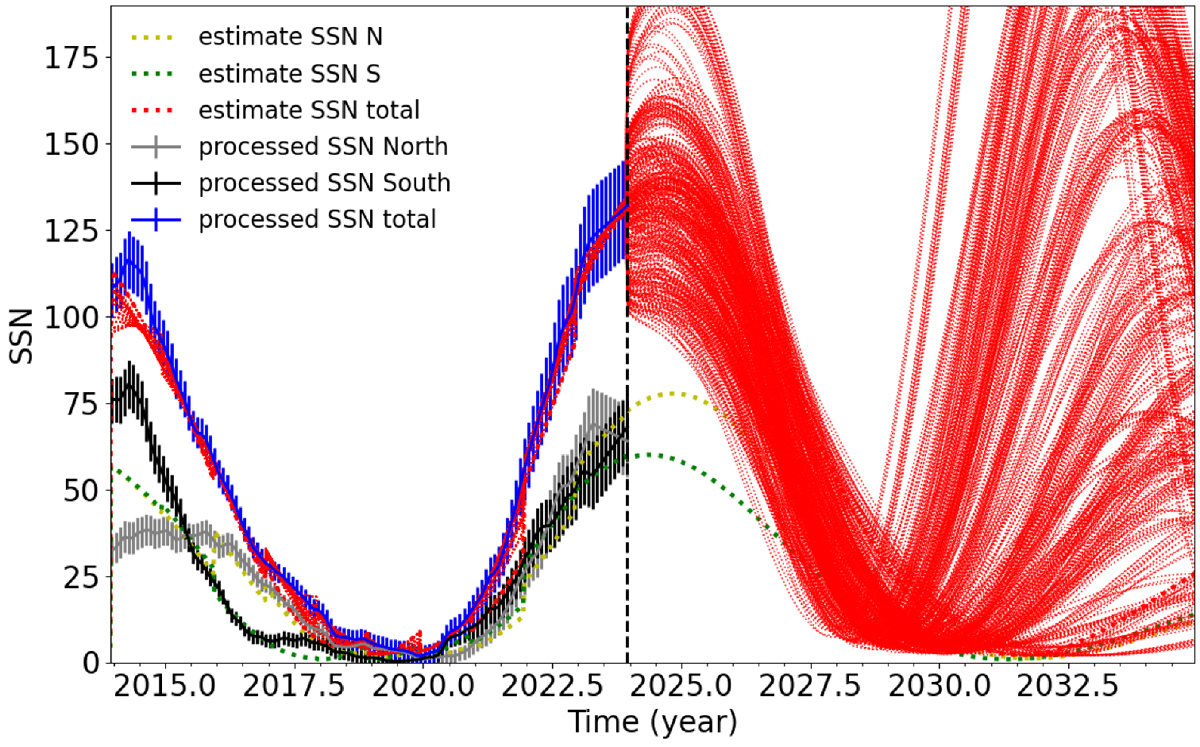
Trajectory of the 480 ensemble members. Example of hemispherical data assimilation starting in mid 2013 and ending in τexyr = mid 2023. The 12 × 40 = 480 extrapolations (forecast ensemble trajectories) computed by the solar dynamo model are starting beyond that time. We clearly see that further we look in the future larger the spread is both in amplitude and timing of the next maximum of cycle 26. Forecast of the next minimum around 2030 is within our temporal horizon limit at the time of the writing of the paper. In order not to overcomplicate the figure, we voluntarily omit to plot the 2 × 480 trajectories of each hemisphere.
Current usage metrics show cumulative count of Article Views (full-text article views including HTML views, PDF and ePub downloads, according to the available data) and Abstracts Views on Vision4Press platform.
Data correspond to usage on the plateform after 2015. The current usage metrics is available 48-96 hours after online publication and is updated daily on week days.
Initial download of the metrics may take a while.