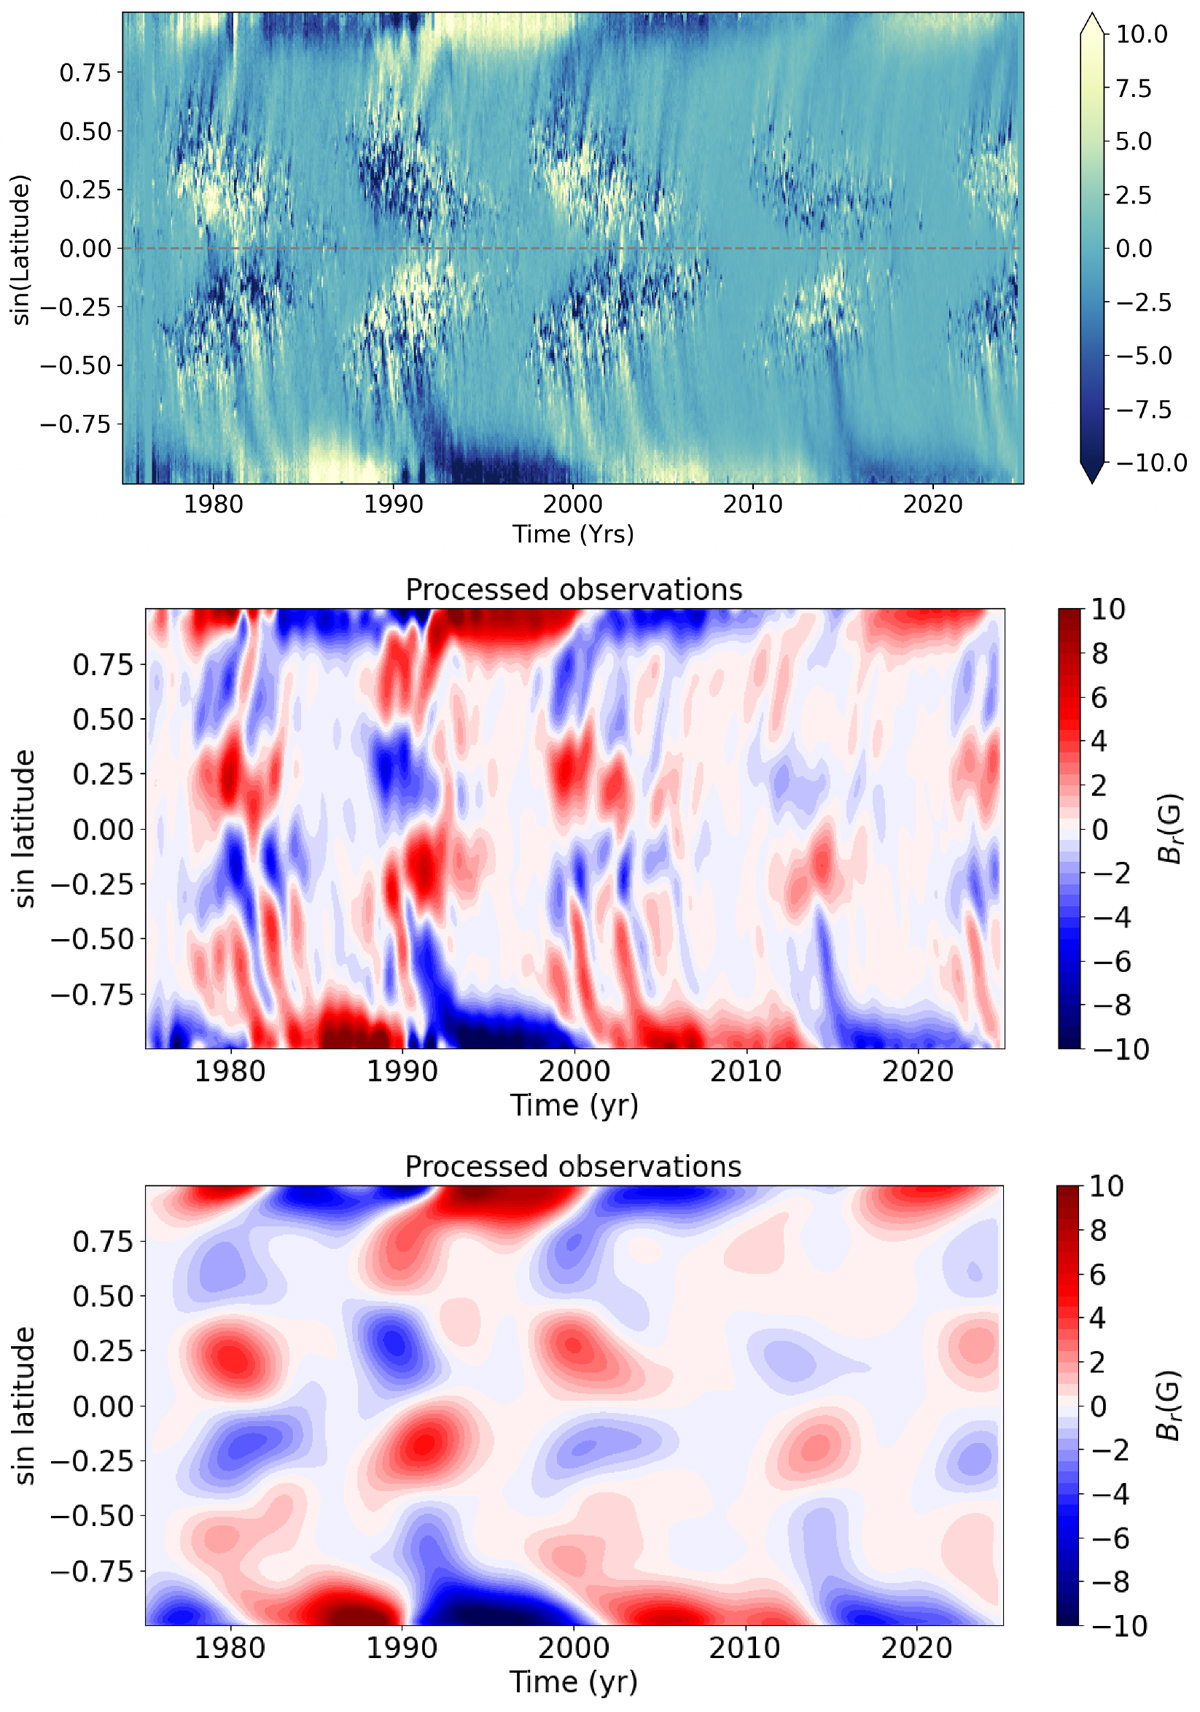
Fig. 2.
Download original image
Magnetic butterfly diagram depicts the azimuthally averaged magnetic synoptic maps (coming from various sources) for each Carrington rotation from CR1625 until CR2288 and stacked in time. Top row: Unfiltered data and one-year (middle row) and five-year (bottom row) filtered versions. The later two can be used as line-of-sight magnetic field observations in our assimilation pipeline.
Current usage metrics show cumulative count of Article Views (full-text article views including HTML views, PDF and ePub downloads, according to the available data) and Abstracts Views on Vision4Press platform.
Data correspond to usage on the plateform after 2015. The current usage metrics is available 48-96 hours after online publication and is updated daily on week days.
Initial download of the metrics may take a while.