Open Access
Fig. 15.
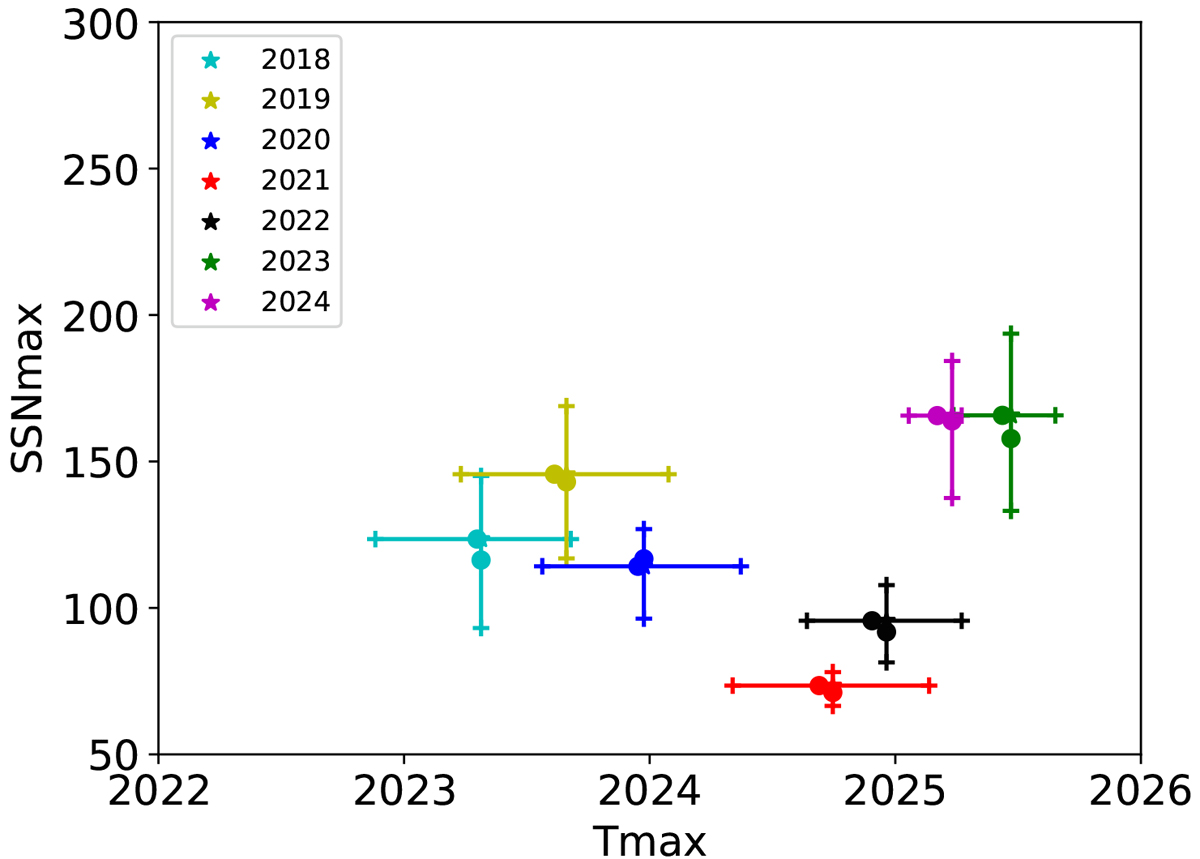
Download original image
Same as Fig. 6 but for cycle 25. We added two extra phases of the cycle here, finishing in 2018 and 2019 (i.e., before the previous minimum).
Current usage metrics show cumulative count of Article Views (full-text article views including HTML views, PDF and ePub downloads, according to the available data) and Abstracts Views on Vision4Press platform.
Data correspond to usage on the plateform after 2015. The current usage metrics is available 48-96 hours after online publication and is updated daily on week days.
Initial download of the metrics may take a while.