Open Access
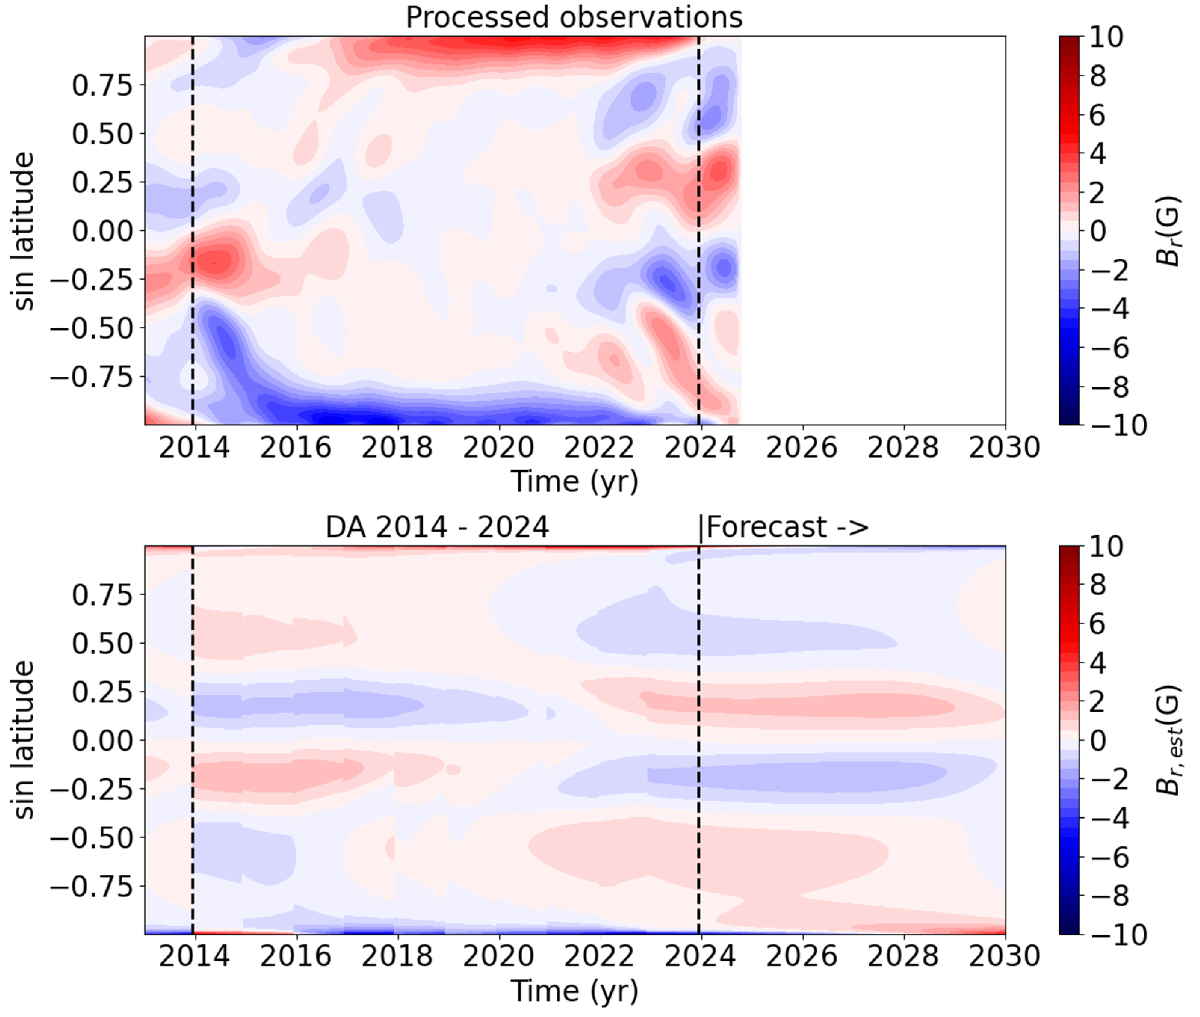
Fig. 11.
Download original image
Solar cycle 25 forecasts as of December 2023, for the butterfly diagram. The observed radial field is shown in the top panel and the results of the assimilation phase (from 2014 to 2024) and forecast (from 2024) are illustrated on the bottom panel.
Current usage metrics show cumulative count of Article Views (full-text article views including HTML views, PDF and ePub downloads, according to the available data) and Abstracts Views on Vision4Press platform.
Data correspond to usage on the plateform after 2015. The current usage metrics is available 48-96 hours after online publication and is updated daily on week days.
Initial download of the metrics may take a while.