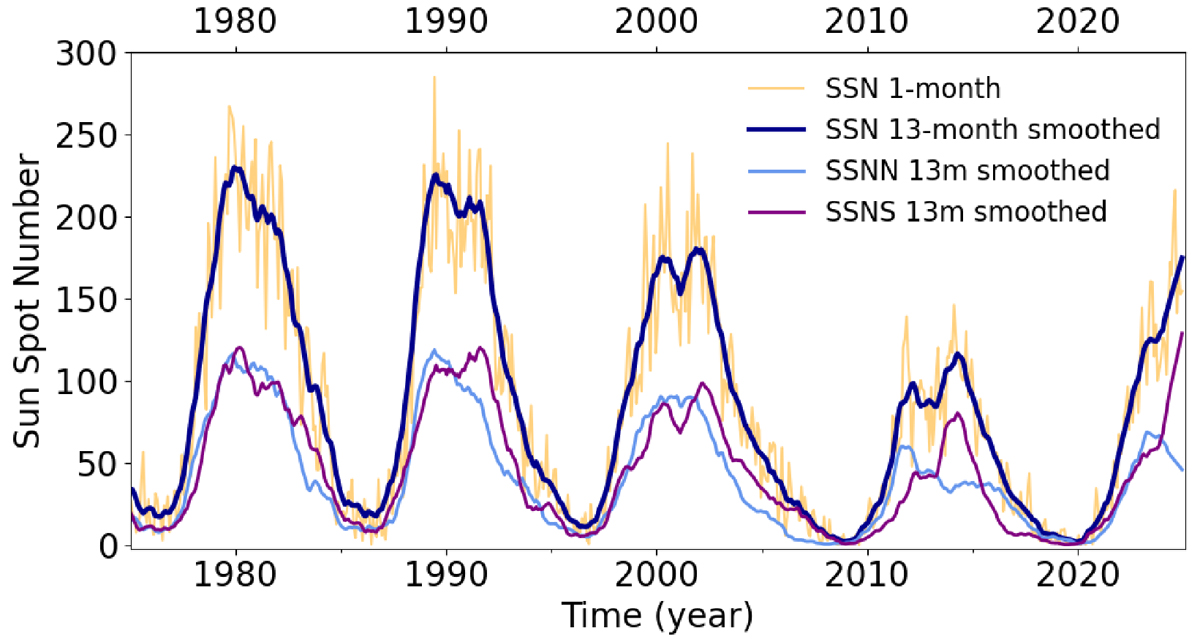
Fig. 1.
Download original image
SSN time series used in the assimilation procedure. We assimilate the hemispherical data and can choose to either forecast the total or hemispherical solar activity. Shown in dark blue is the total 13-month smoothed SSN times series and in light blue shades the northern and southern sub time series (north + south = total). We superimpose in orange the monthly data, which is six months ahead by construction.
Current usage metrics show cumulative count of Article Views (full-text article views including HTML views, PDF and ePub downloads, according to the available data) and Abstracts Views on Vision4Press platform.
Data correspond to usage on the plateform after 2015. The current usage metrics is available 48-96 hours after online publication and is updated daily on week days.
Initial download of the metrics may take a while.