Fig. 7.
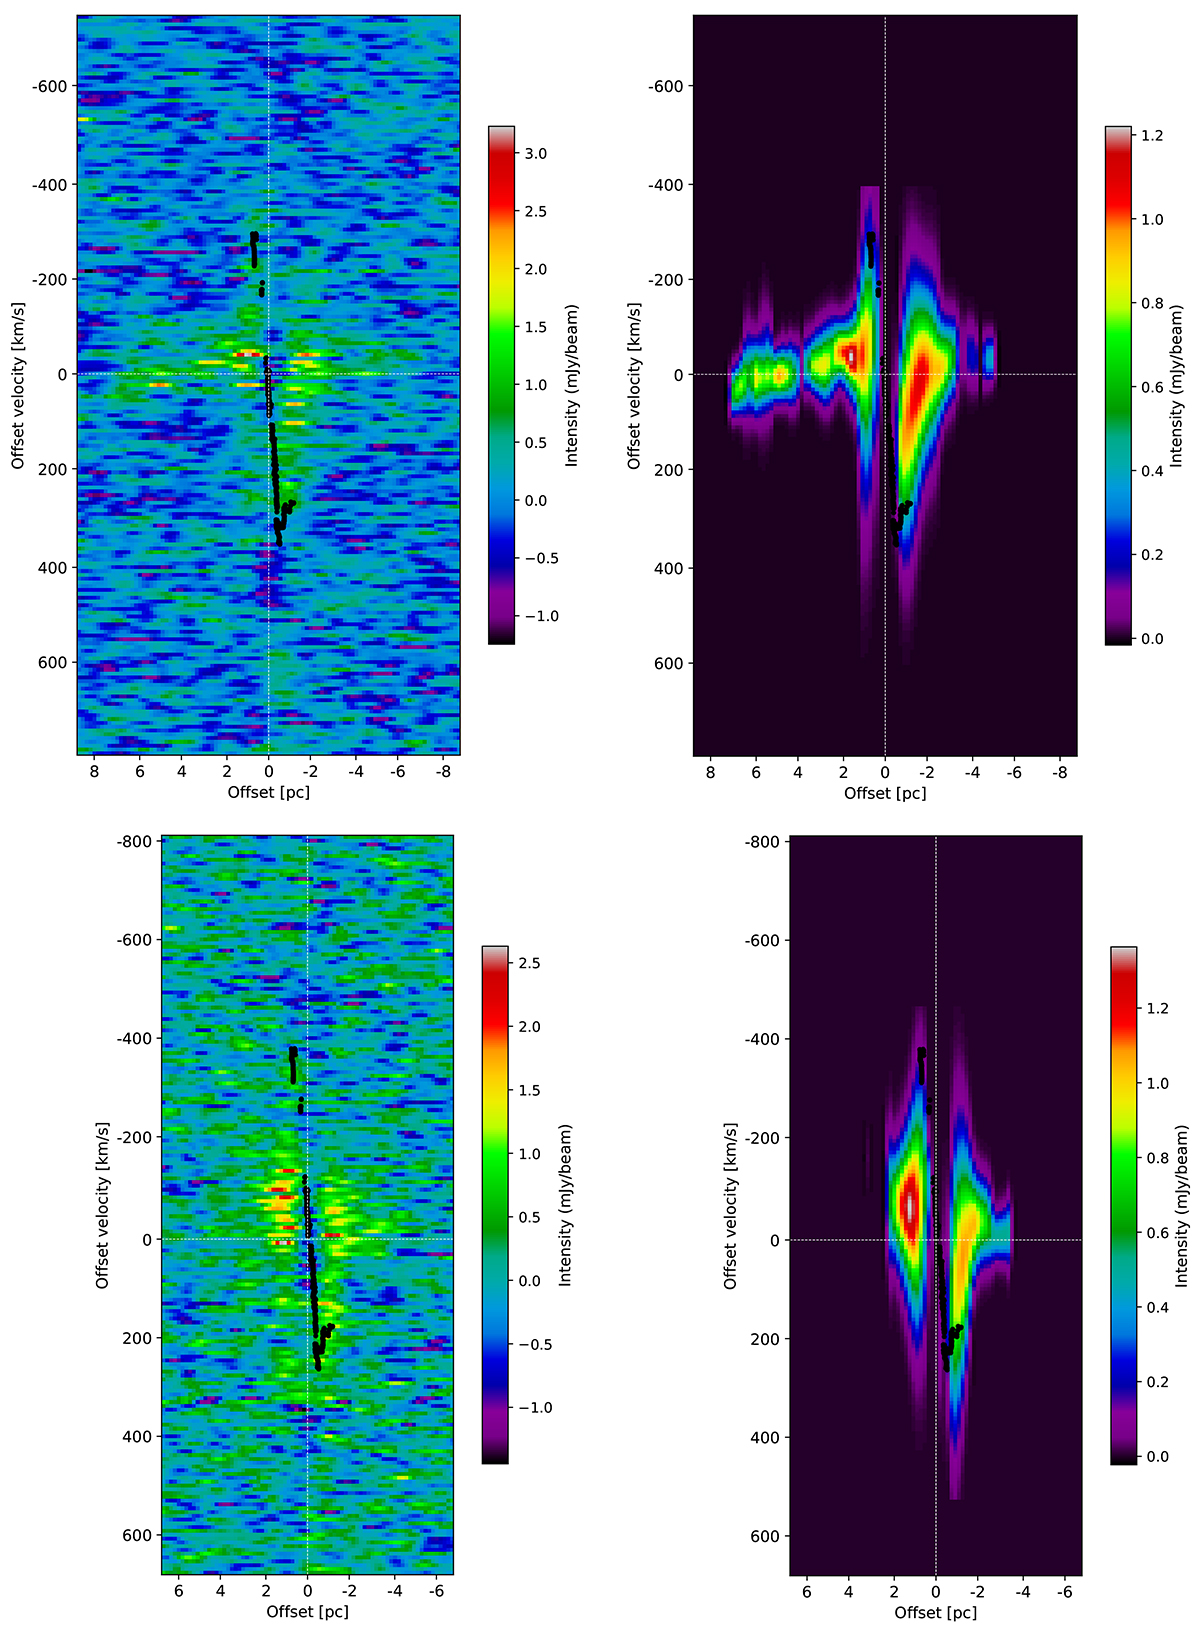
Download original image
Position-velocity diagram of the CO (J = 3→2) (top) and the HCO+ (J = 4→3) (bottom) along the major axis originated from the data (left) and the Gaussian fits (right). Black dots on the two top panels mark the positions of the H2O masers (Gallimore & Impellizzeri 2023). East is almost to the left, taking into account the PA used to make the diagram (PA = 114°).
Current usage metrics show cumulative count of Article Views (full-text article views including HTML views, PDF and ePub downloads, according to the available data) and Abstracts Views on Vision4Press platform.
Data correspond to usage on the plateform after 2015. The current usage metrics is available 48-96 hours after online publication and is updated daily on week days.
Initial download of the metrics may take a while.