Open Access
Fig. 6.
Download original image
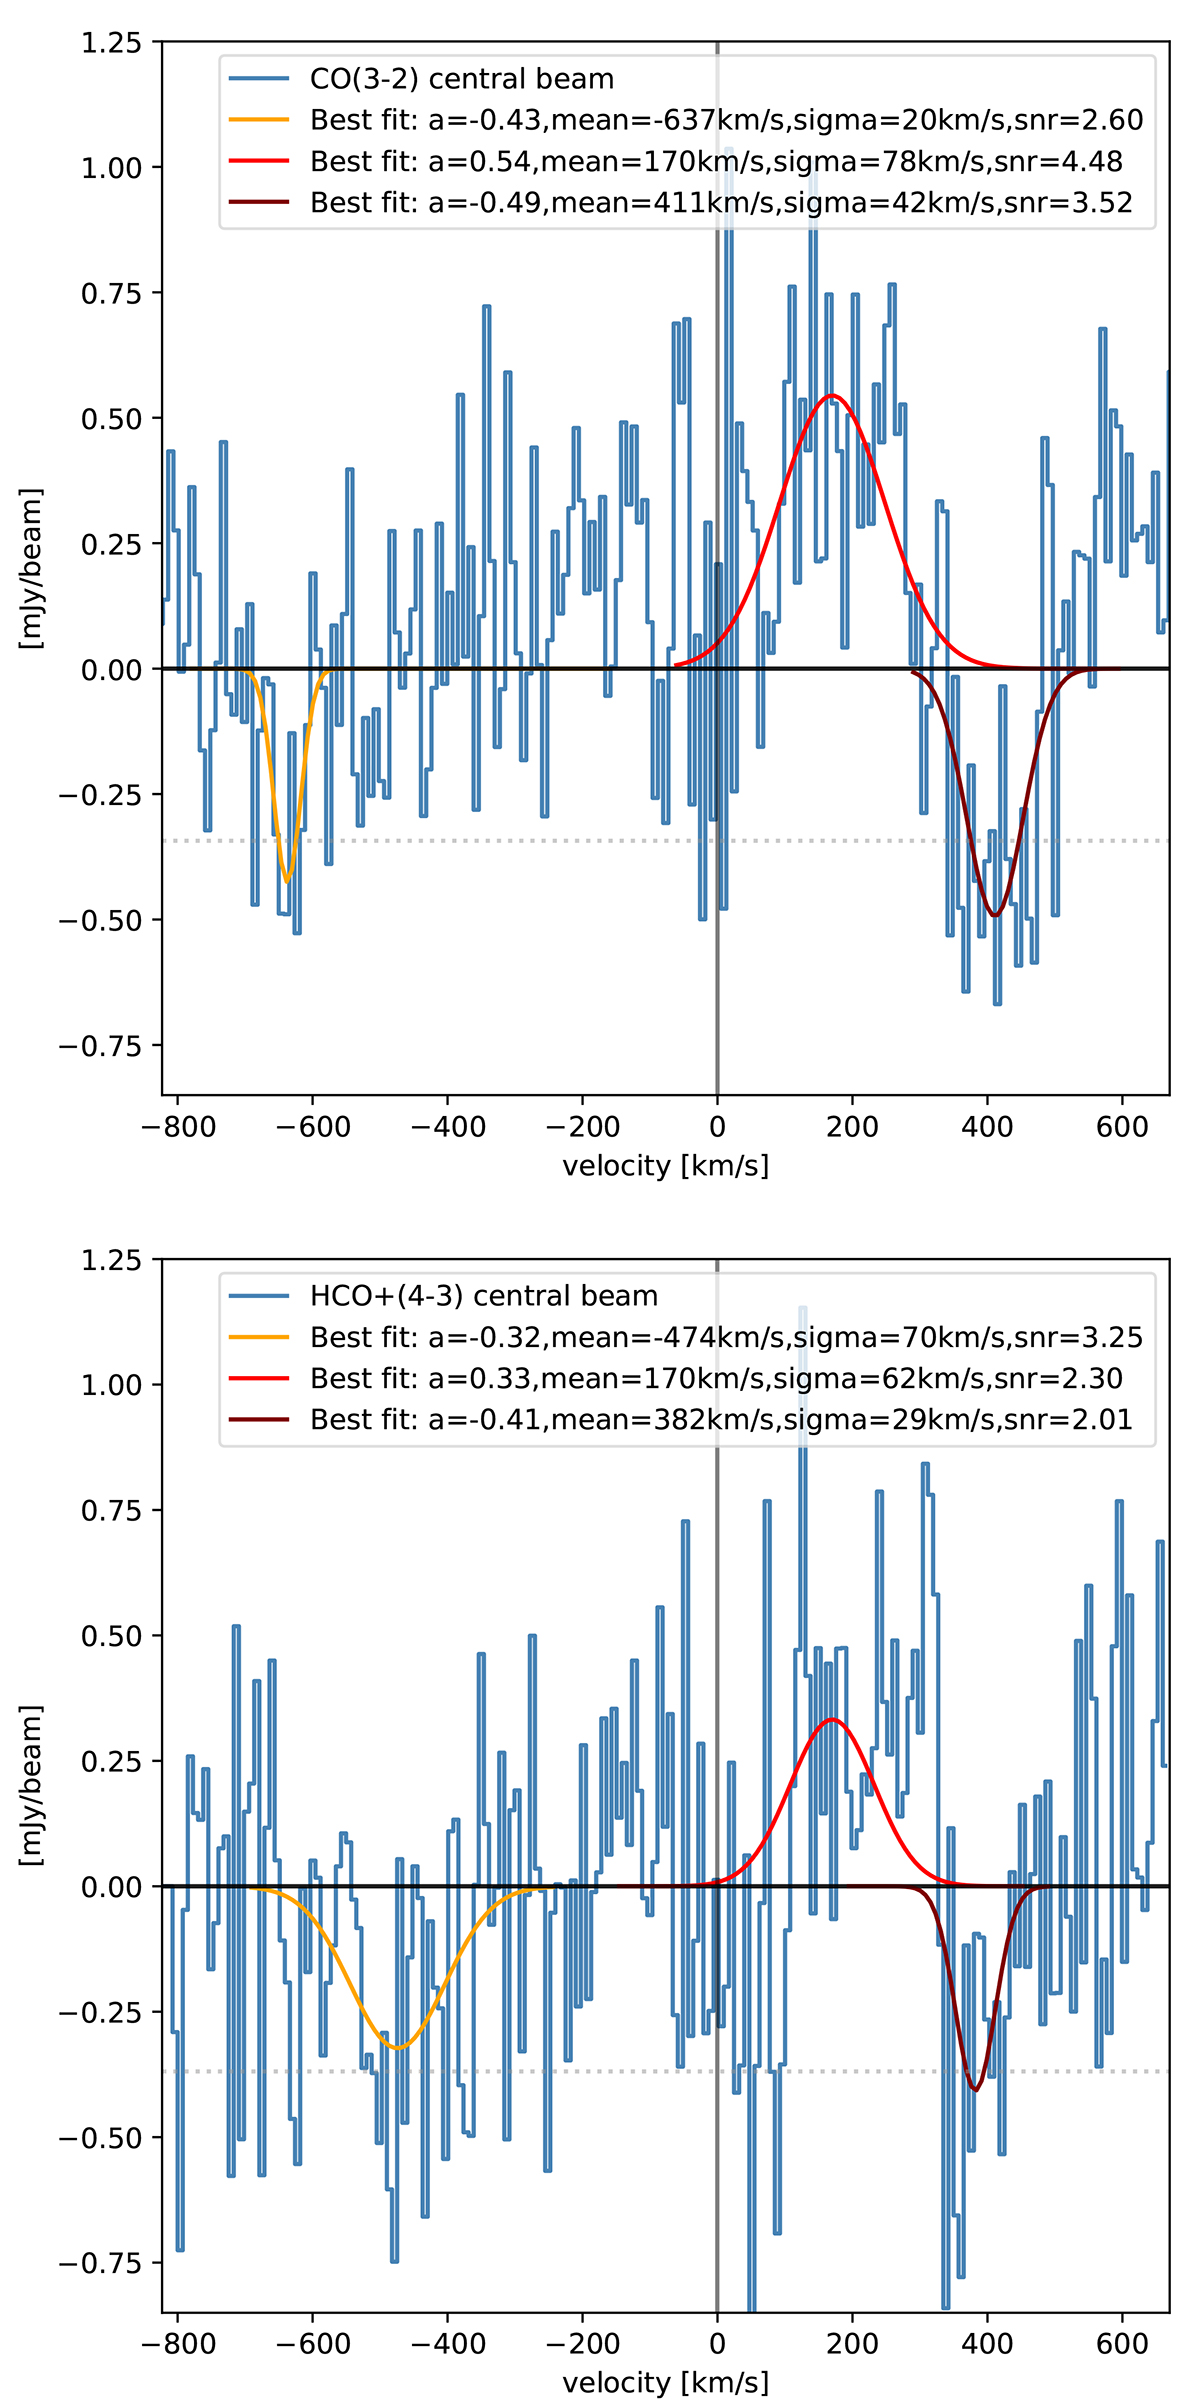
Gaussian fits of the absorption and emission features of the CO (J = 3→2) and HCO+ (J = 4→3) spectra belonging to the central beam on top of the peak of the continuum relative to systemic velocity. The dotted line indicates –1 times the rms of the spectrum. For the systemic velocity, we used a value of 1130 km/s.
Current usage metrics show cumulative count of Article Views (full-text article views including HTML views, PDF and ePub downloads, according to the available data) and Abstracts Views on Vision4Press platform.
Data correspond to usage on the plateform after 2015. The current usage metrics is available 48-96 hours after online publication and is updated daily on week days.
Initial download of the metrics may take a while.