Fig. 6
Download original image
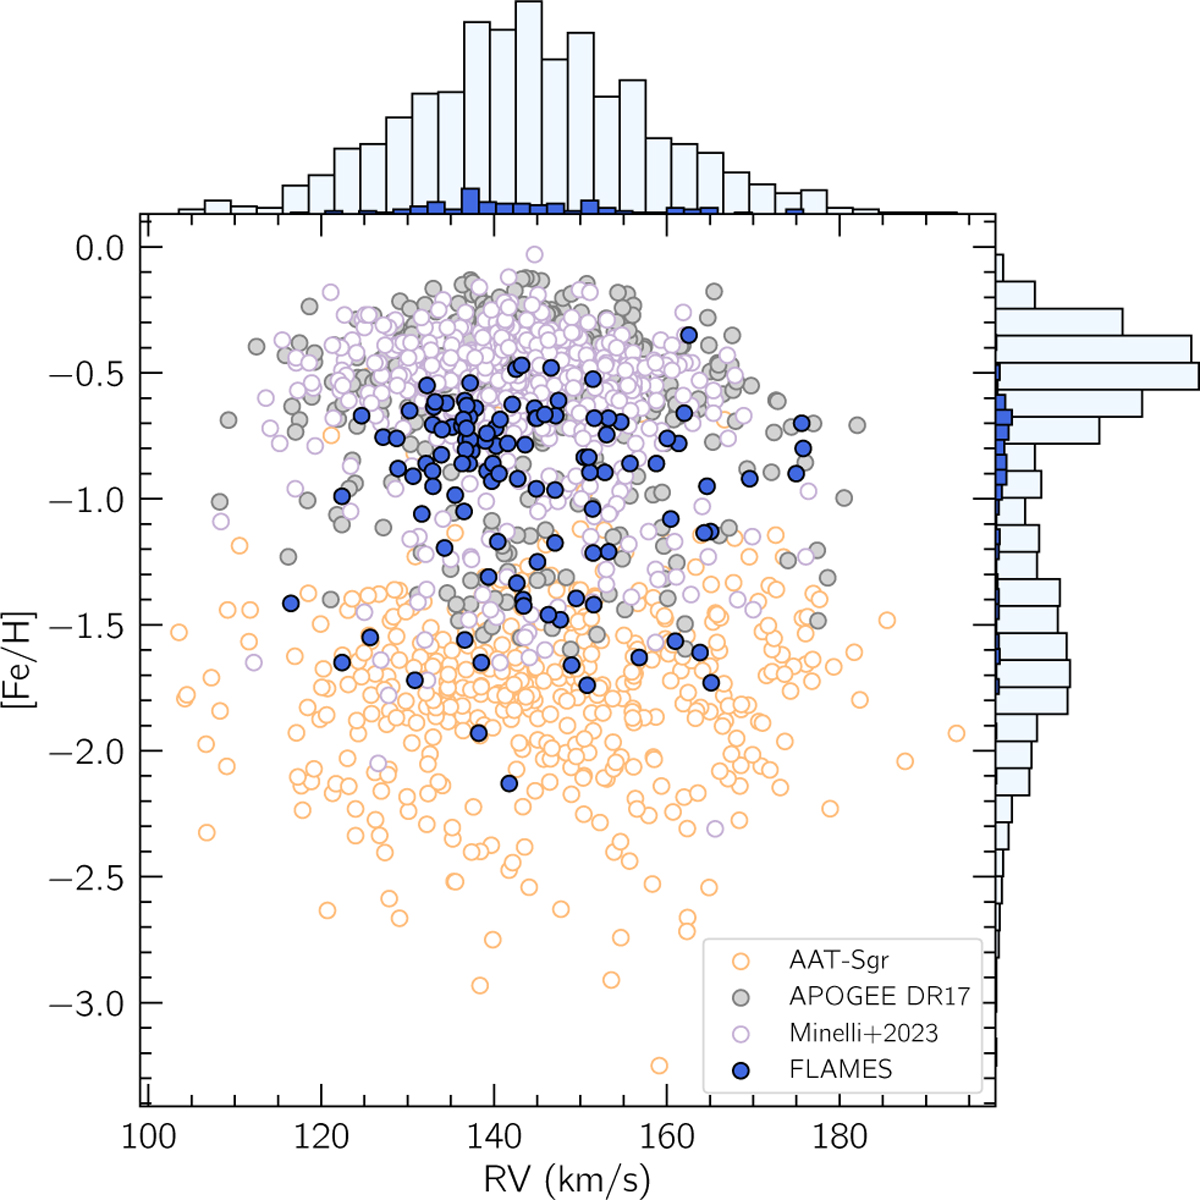
Metallicities and RVs for the Sgr members observed in this study are compared with those from three literature samples. These are the same samples shown in Fig. 4, and the selection criteria applied are similar to those used for the FLAMES targets. Top: histogram of RVs, with literature data shown in light blue and our targets in blue. Bottom right: histogram of metallicities, using the same color scheme as the RV histogram.
Current usage metrics show cumulative count of Article Views (full-text article views including HTML views, PDF and ePub downloads, according to the available data) and Abstracts Views on Vision4Press platform.
Data correspond to usage on the plateform after 2015. The current usage metrics is available 48-96 hours after online publication and is updated daily on week days.
Initial download of the metrics may take a while.