Fig. 5
Download original image
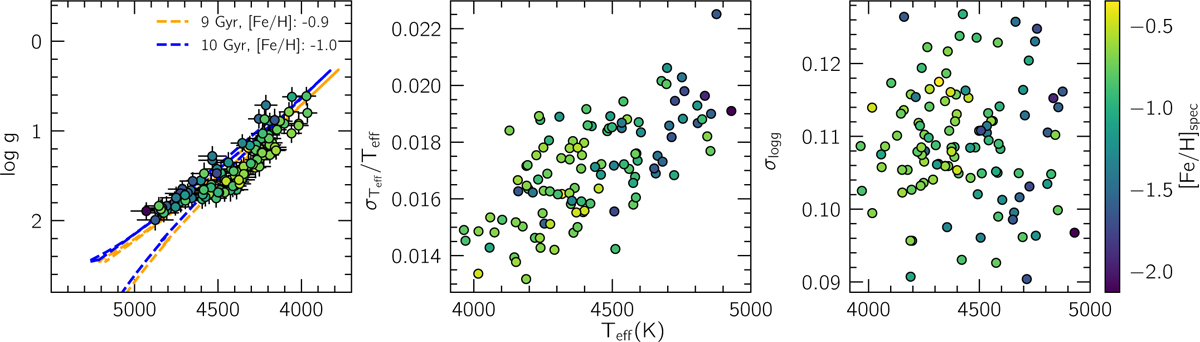
Kiel diagram and parameter uncertainties of our stellar sample. Left: Kiel diagram with the parameters derived through photometry. All points are color coded by their spectroscopic metallicities. Two examples of BaSTI isochrones are shown and zoomed in around the evolutionary stage of our giant stars. Central and right: the Teff relative uncertainties and log g absolute uncertainties vs. effective temperatures for the entire sample following the same color coding as the Kiel diagram.
Current usage metrics show cumulative count of Article Views (full-text article views including HTML views, PDF and ePub downloads, according to the available data) and Abstracts Views on Vision4Press platform.
Data correspond to usage on the plateform after 2015. The current usage metrics is available 48-96 hours after online publication and is updated daily on week days.
Initial download of the metrics may take a while.