Fig. 4
Download original image
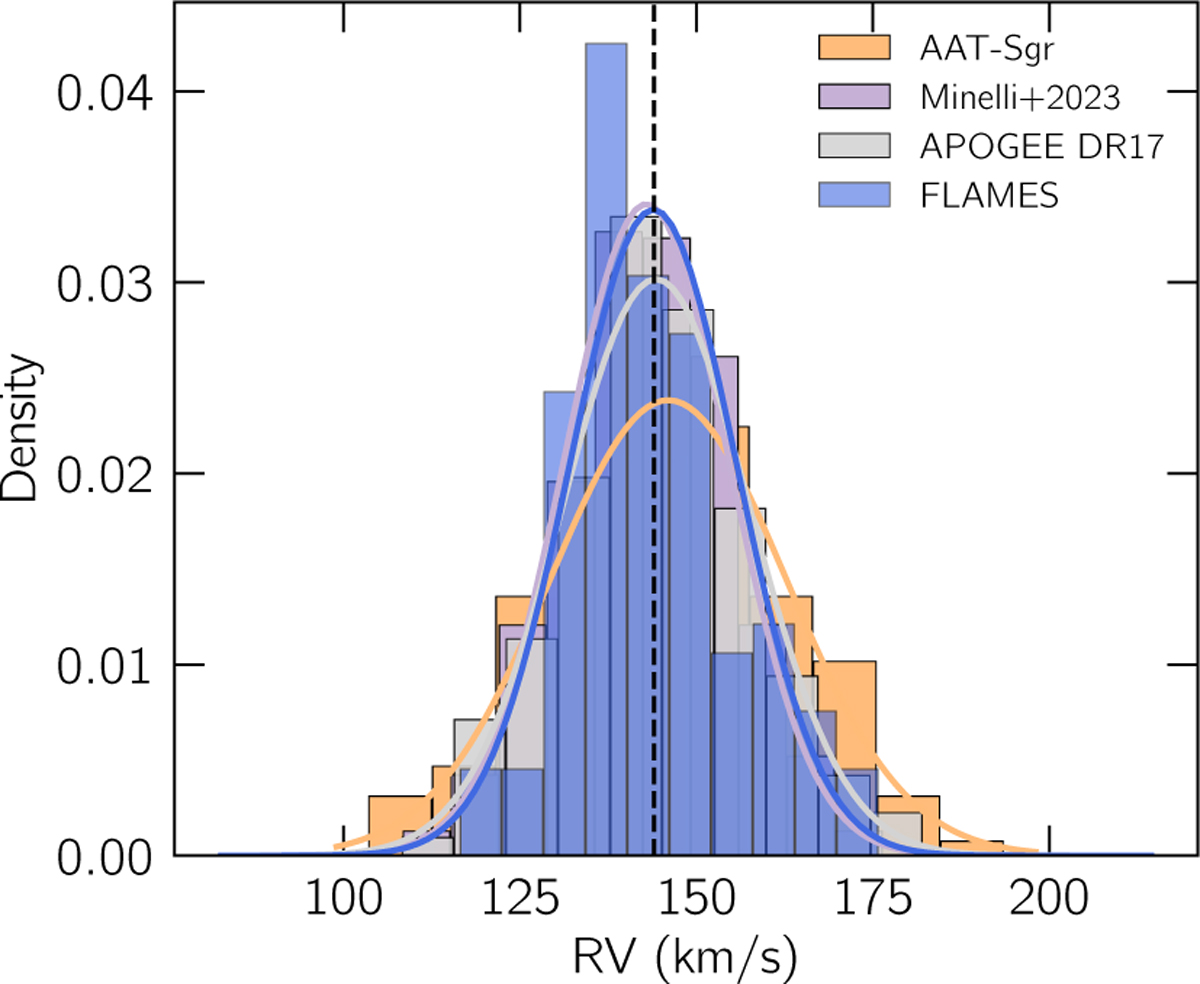
Normalized distribution of RVs for Sgr samples. The target stars presented in this work appear in blue. The Sgr selections from Sestito et al. (2024a), Minelli et al. (2023) and Abdurro’uf et al. (2022) are colored according to the legend. The continuous lines represent KDE curves, colored to match the corresponding Gaussian distributions. The average RV values occur at 143.9 km s−1 marked with the vertical dashed line.
Current usage metrics show cumulative count of Article Views (full-text article views including HTML views, PDF and ePub downloads, according to the available data) and Abstracts Views on Vision4Press platform.
Data correspond to usage on the plateform after 2015. The current usage metrics is available 48-96 hours after online publication and is updated daily on week days.
Initial download of the metrics may take a while.