Open Access
Fig. 12
Download original image
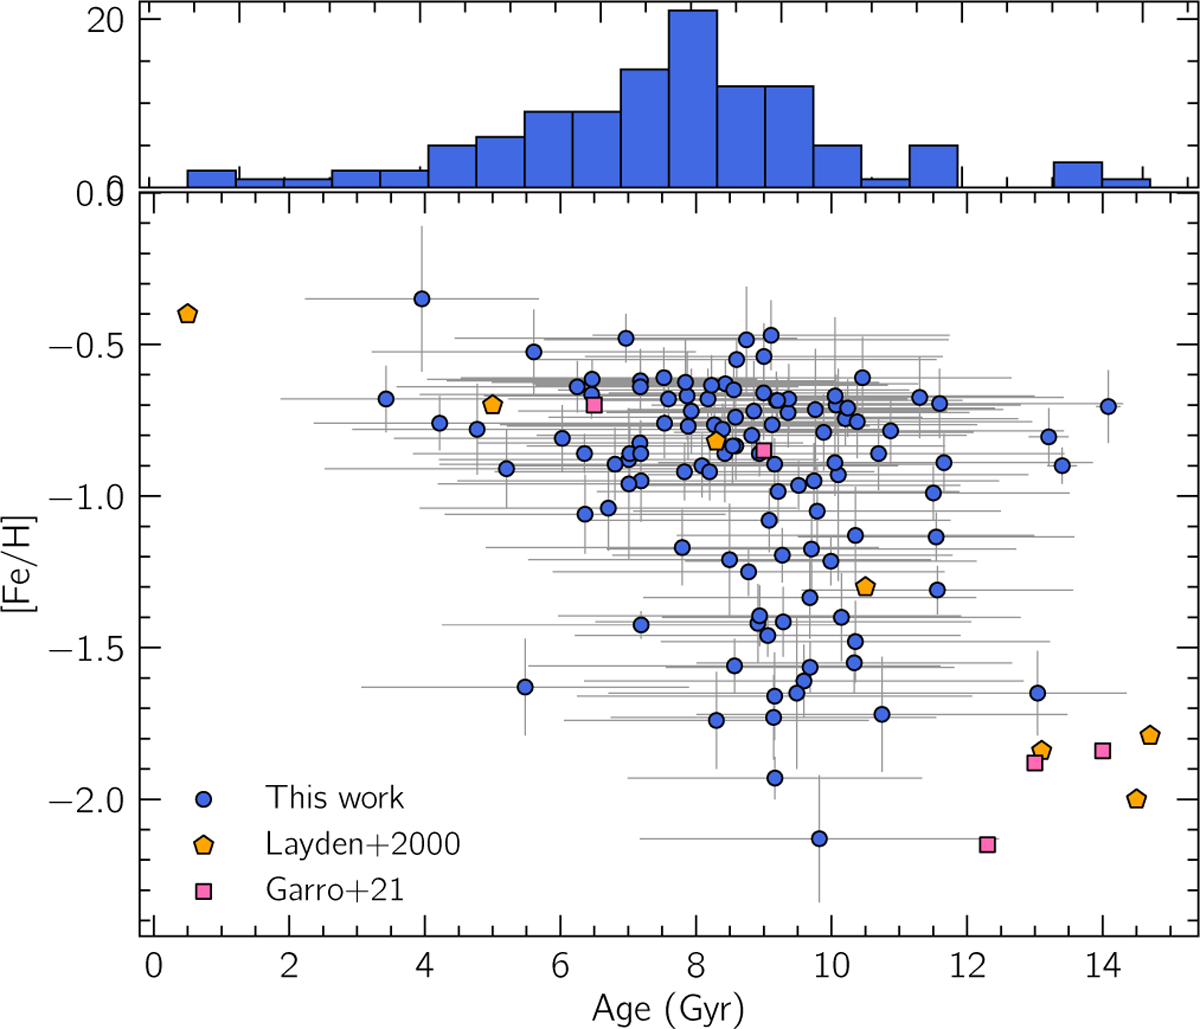
Age–metallicity relation for the Sgr stellar sample (blue circles). The pink dots indicate five GCs associated to the Sgr streams reported by Garro et al. (2021), while the orange pentagons represent both GCs and the Sgr field population derived with isochrone fitting by Layden & Sarajedini (2000).
Current usage metrics show cumulative count of Article Views (full-text article views including HTML views, PDF and ePub downloads, according to the available data) and Abstracts Views on Vision4Press platform.
Data correspond to usage on the plateform after 2015. The current usage metrics is available 48-96 hours after online publication and is updated daily on week days.
Initial download of the metrics may take a while.