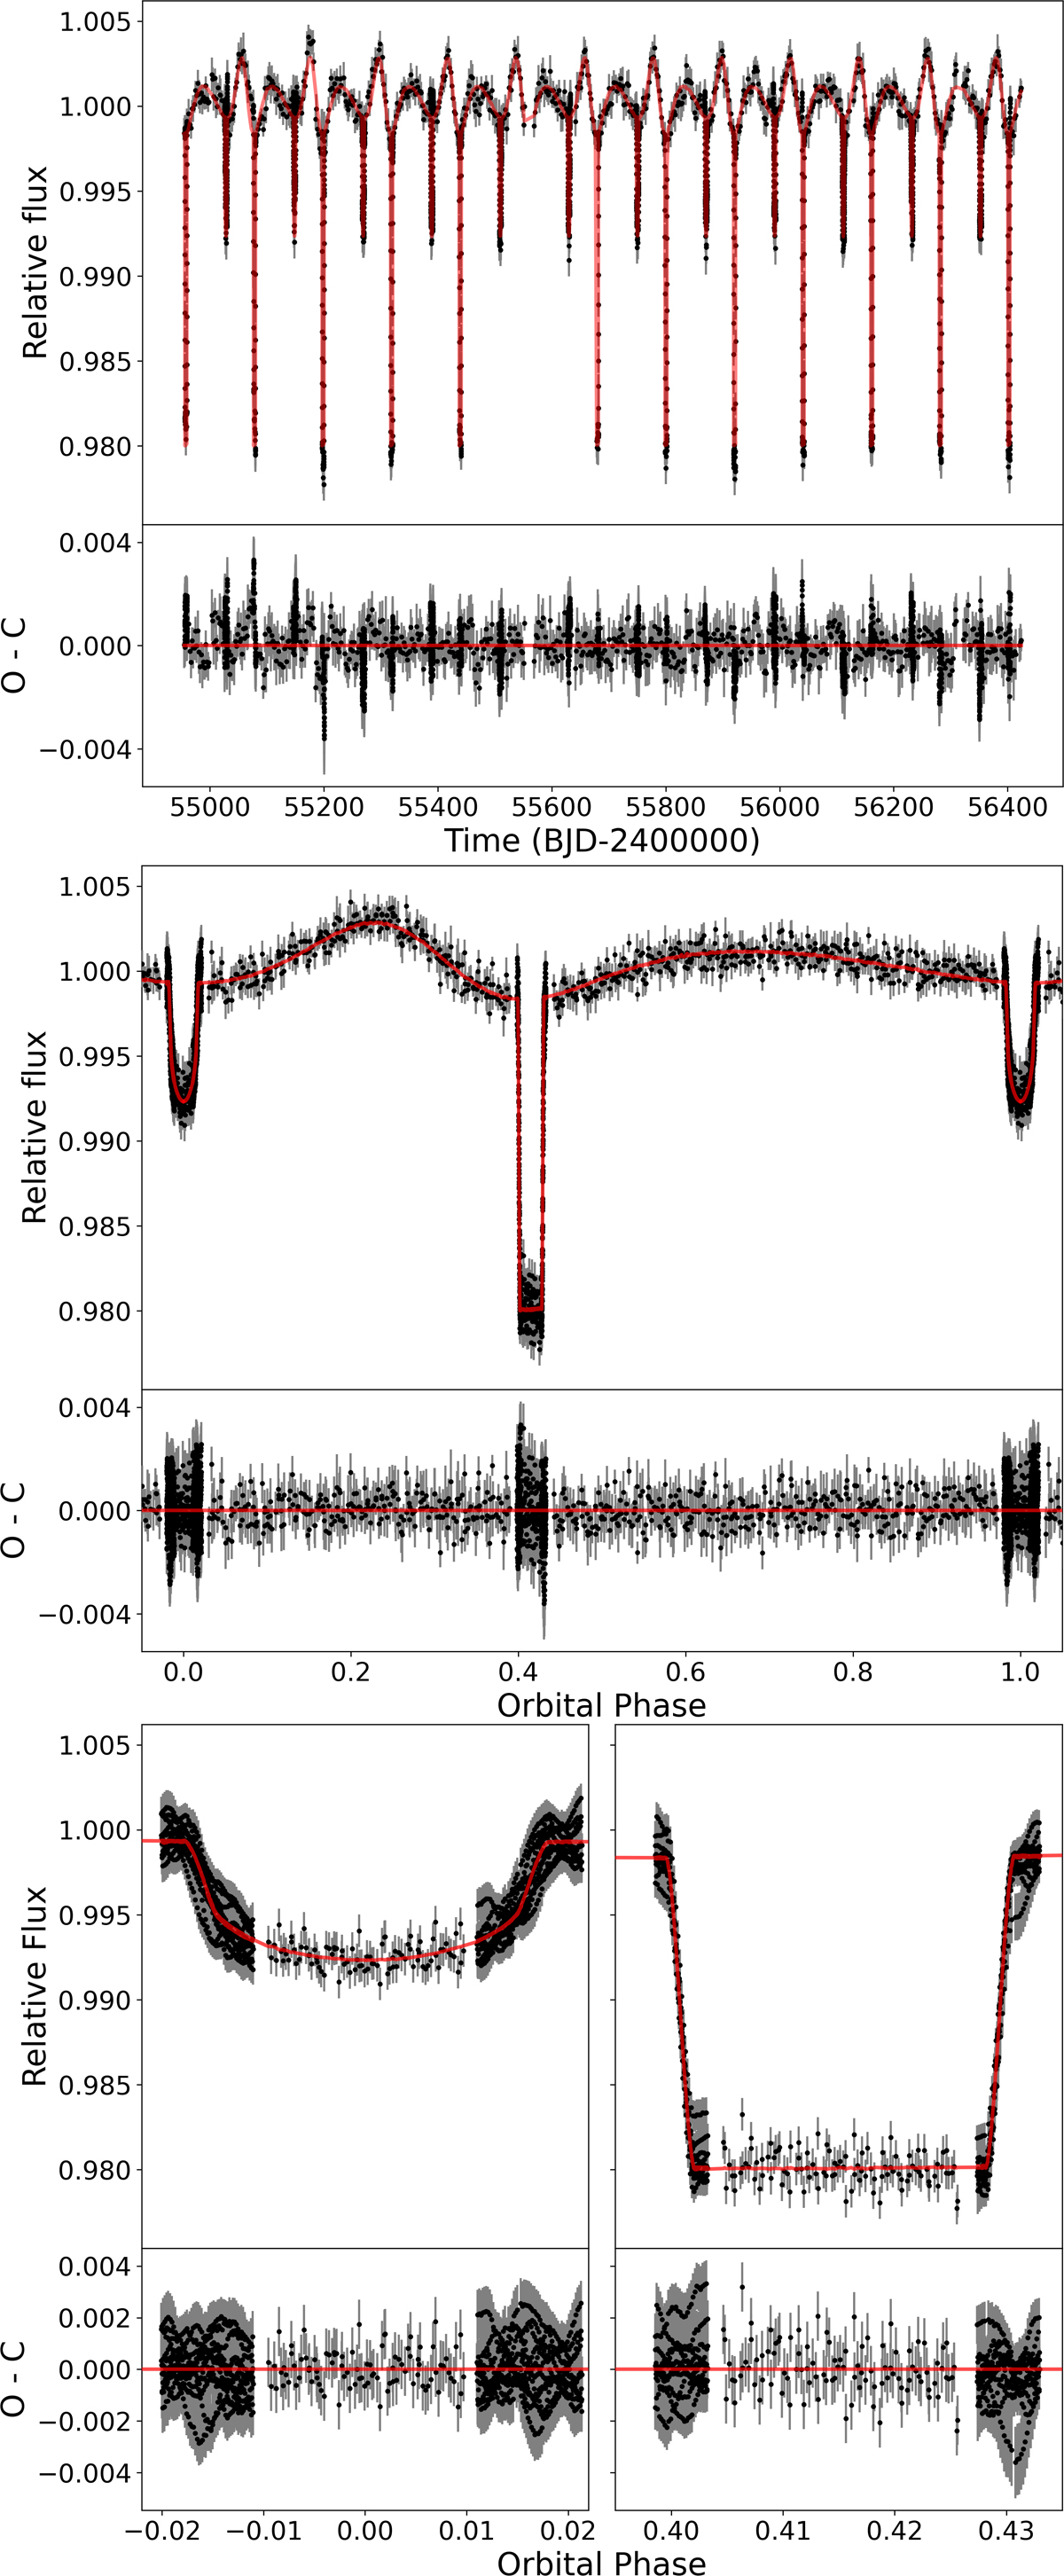
Fig. D.2.
Download original image
Eclipsing binary model fits with PHOEBE 2 to independently filtered KASOC light curve for KIC 10001167. Top panels illustrate the binned light curve (black points) and model (red) with time on the x-axis. Middle panels show the same, but with orbital phase on the x-axis. The bottom panels show zoomed-in views of just the two eclipses (phase-folded). The data have been binned in time, in three different ways depending on phase. See the text for details. The gaps between different binnings is a consequence of time-averaging within the bins, and a hard cut to avoid data overlap between them.
Current usage metrics show cumulative count of Article Views (full-text article views including HTML views, PDF and ePub downloads, according to the available data) and Abstracts Views on Vision4Press platform.
Data correspond to usage on the plateform after 2015. The current usage metrics is available 48-96 hours after online publication and is updated daily on week days.
Initial download of the metrics may take a while.