Fig. 3.
Download original image
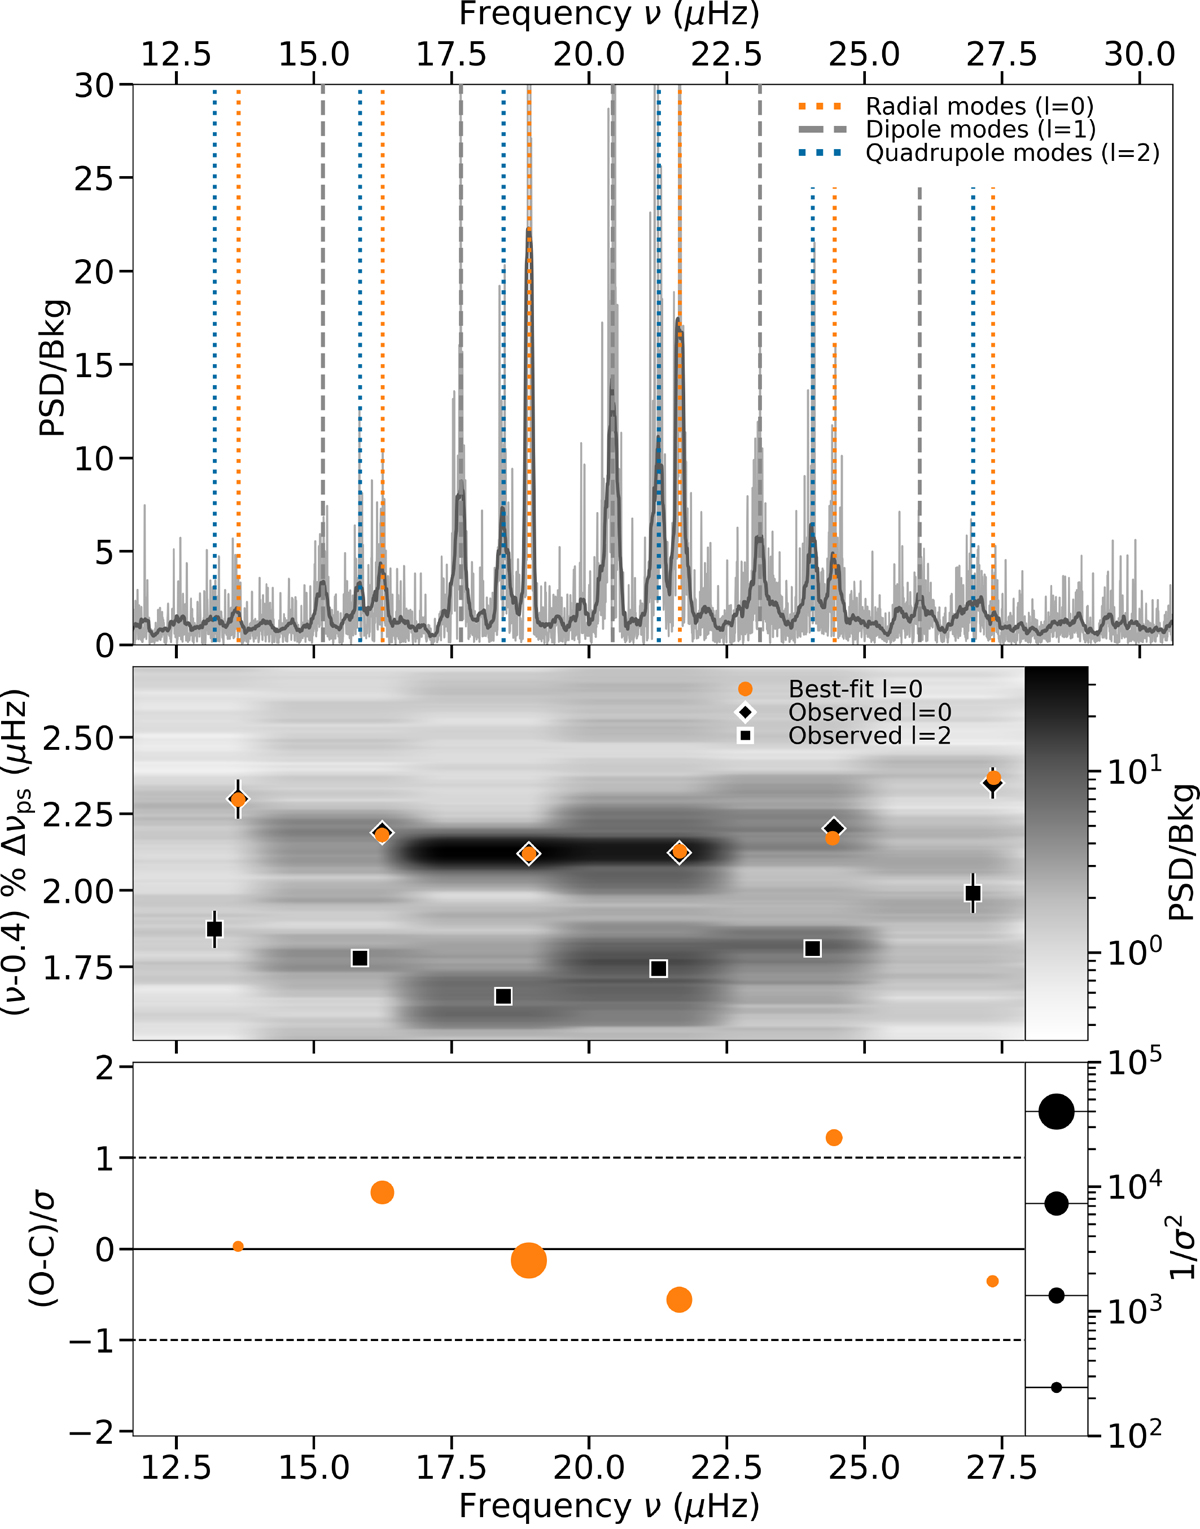
Top: Frequency-power spectrum divided by the granulation background in the original (light) and uniformly smoothed (dark, window = 0.15 μHz). The vertical lines highlight the observed radial (ℓ = 0), dipole (ℓ = 1), and quadrupole (ℓ = 2) modes. Middle: Échelle diagram. The axes are flipped for illustration, showing observed radial ℓ = 0 and quadrupole ℓ = 2 frequencies and the best-fit frequencies from our reference radial mode fit. The heat-map data were uniformly smoothed with a window = 0.075 μHz. Bottom: Statistical significance of the O-C residuals relative to the measurement uncertainty σ. The marker-size was rescaled (in log10) to demonstrate the statistical weight 1/σ2 applied to each observed frequency in the asteroseismic inference.
Current usage metrics show cumulative count of Article Views (full-text article views including HTML views, PDF and ePub downloads, according to the available data) and Abstracts Views on Vision4Press platform.
Data correspond to usage on the plateform after 2015. The current usage metrics is available 48-96 hours after online publication and is updated daily on week days.
Initial download of the metrics may take a while.