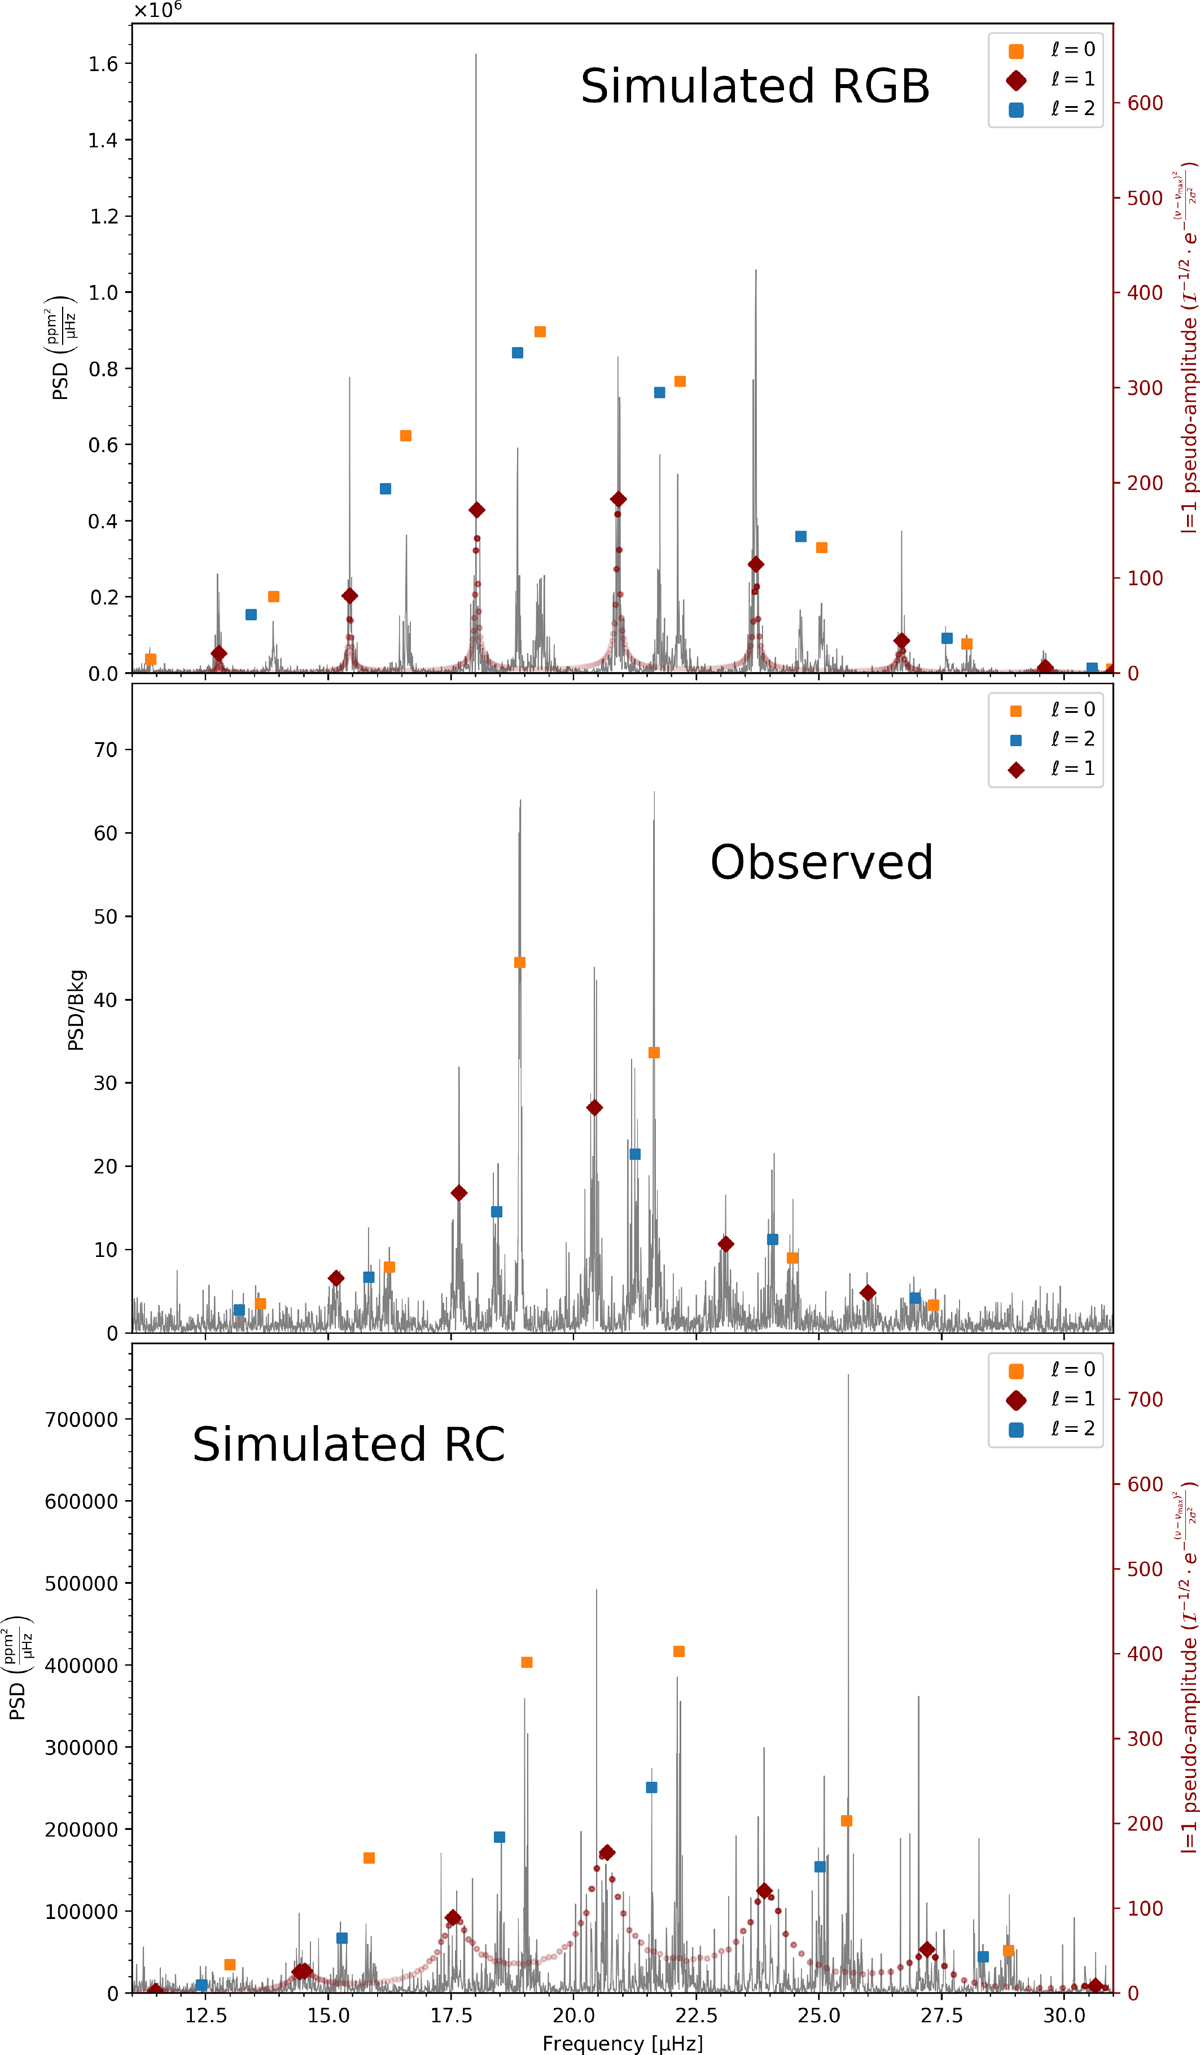
Fig. H.1.
Download original image
Top panel: Simulated power spectral density (PSD) for RGB star. Middle panel: Observed PSD, divided by granulation background. Bottom panel: Simulated PSD for a late-clump/early AGB star. For the simulated PSD, the mixed ℓ = 1 modes are highlighted, with an amplitude proxy calculated from the mode inertia and a Gaussian envelope.
Current usage metrics show cumulative count of Article Views (full-text article views including HTML views, PDF and ePub downloads, according to the available data) and Abstracts Views on Vision4Press platform.
Data correspond to usage on the plateform after 2015. The current usage metrics is available 48-96 hours after online publication and is updated daily on week days.
Initial download of the metrics may take a while.