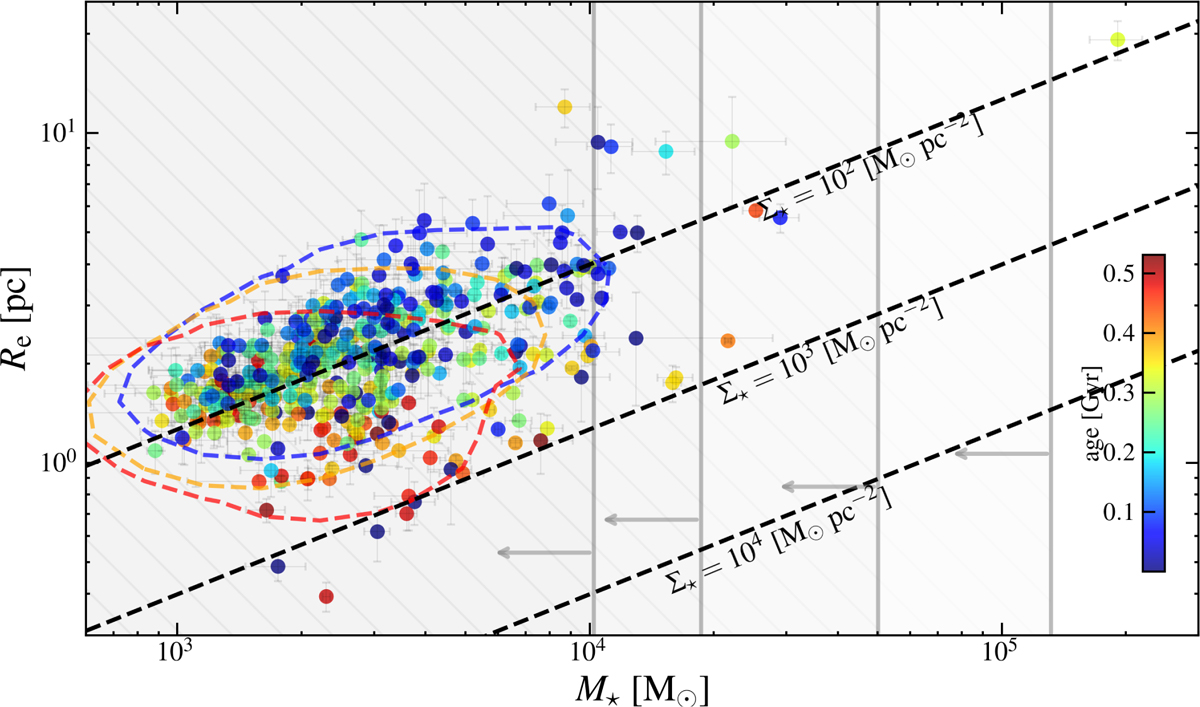
Fig. 7
Download original image
Size-mass relation at a redshift of 7, providing a more detailed view compared to Fig. 5. Clumps are color-coded by age, with blue indicating younger clumps and red representing older clumps. Clumps have been further grouped into age bins: clumps younger than 0.16 Gyr, between 0.16 Gyr and 0.31 Gyr and older than 0.31 Gyr, with each bin containing an equal number of objects. The isodensity contours for the three age distributions are also shown as dashed blue (young), yellow (intermediate-age) and red (old) lines. The grey vertical lines and bands represent the region of space where tdiss ≤ 13 Gyr, with tdiss the same as in Equation (12). Each line corresponds to a different assumption on RG in Equation (12), specifically, from left to right, RG = 18 kpc, 12 kpc, 6 kpc, 3 kpc, together with VG = 220 km s−1 to mimic the tidal field of MW like galaxy (see text for details).
Current usage metrics show cumulative count of Article Views (full-text article views including HTML views, PDF and ePub downloads, according to the available data) and Abstracts Views on Vision4Press platform.
Data correspond to usage on the plateform after 2015. The current usage metrics is available 48-96 hours after online publication and is updated daily on week days.
Initial download of the metrics may take a while.