Fig. 6
Download original image
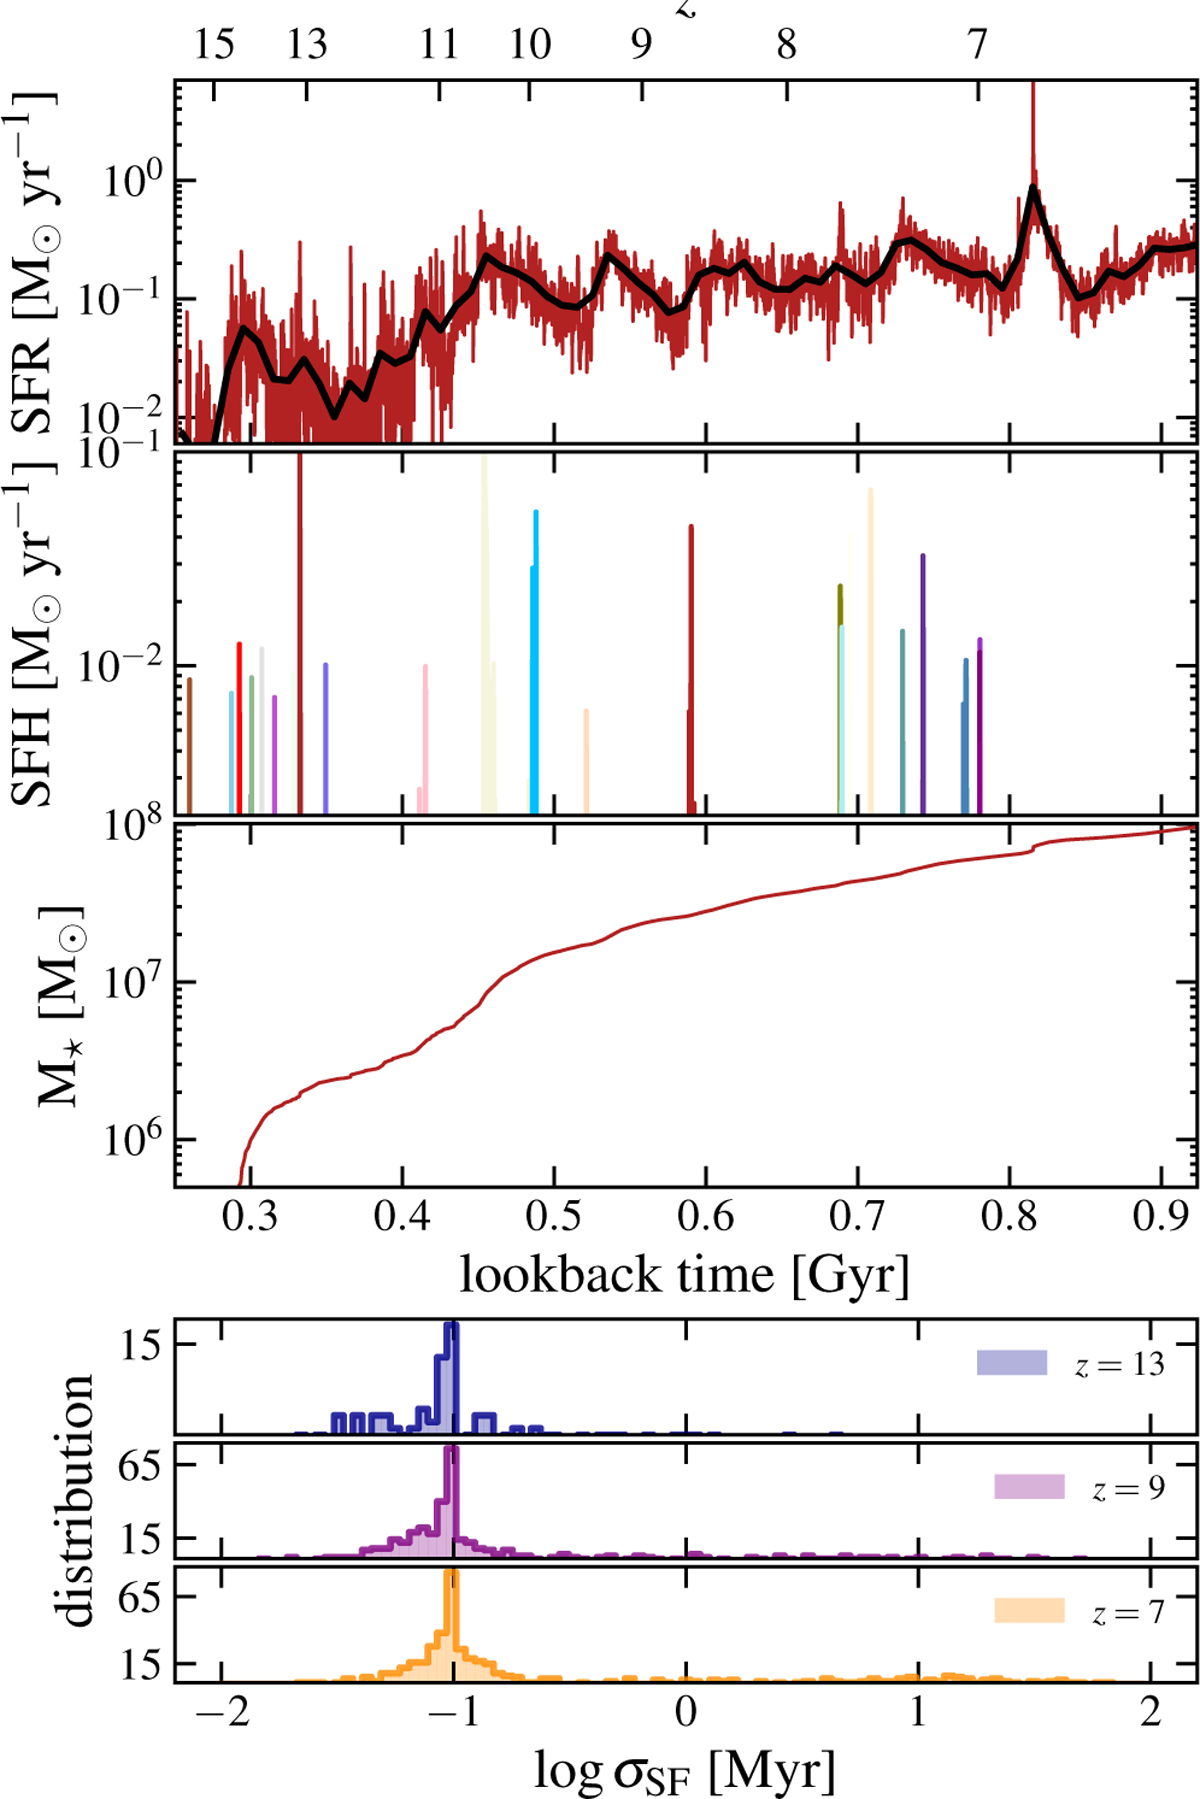
Top panel: SFH of the simulation at redshift 6.14, computed using two different binning schemes. The red line represents the SFH with bins of 0.2 Myr, while the black line uses bins of 10 Myr. Middle panel; star formation histories of a selection of clumps at z = 7. Each clump is color-coded differently, representing a range of variable masses and sizes. Bottom panel: cumulative stellar mass as a function of time. Note: the cumulative mass represents the total stellar mass formed throughout the simulation and does not account for mass loss due to massive stars. Therefore, the effective mass at redshift 6.14 is smaller (see Table 1). The lower panels illustrate the distribution of log σSF, which represents the spread in the SFHs of all clumps (see Equation (13)). This is presented for three distinct redshift values: z = 13, z = 9, and z = 7.
Current usage metrics show cumulative count of Article Views (full-text article views including HTML views, PDF and ePub downloads, according to the available data) and Abstracts Views on Vision4Press platform.
Data correspond to usage on the plateform after 2015. The current usage metrics is available 48-96 hours after online publication and is updated daily on week days.
Initial download of the metrics may take a while.