Fig. 5
Download original image
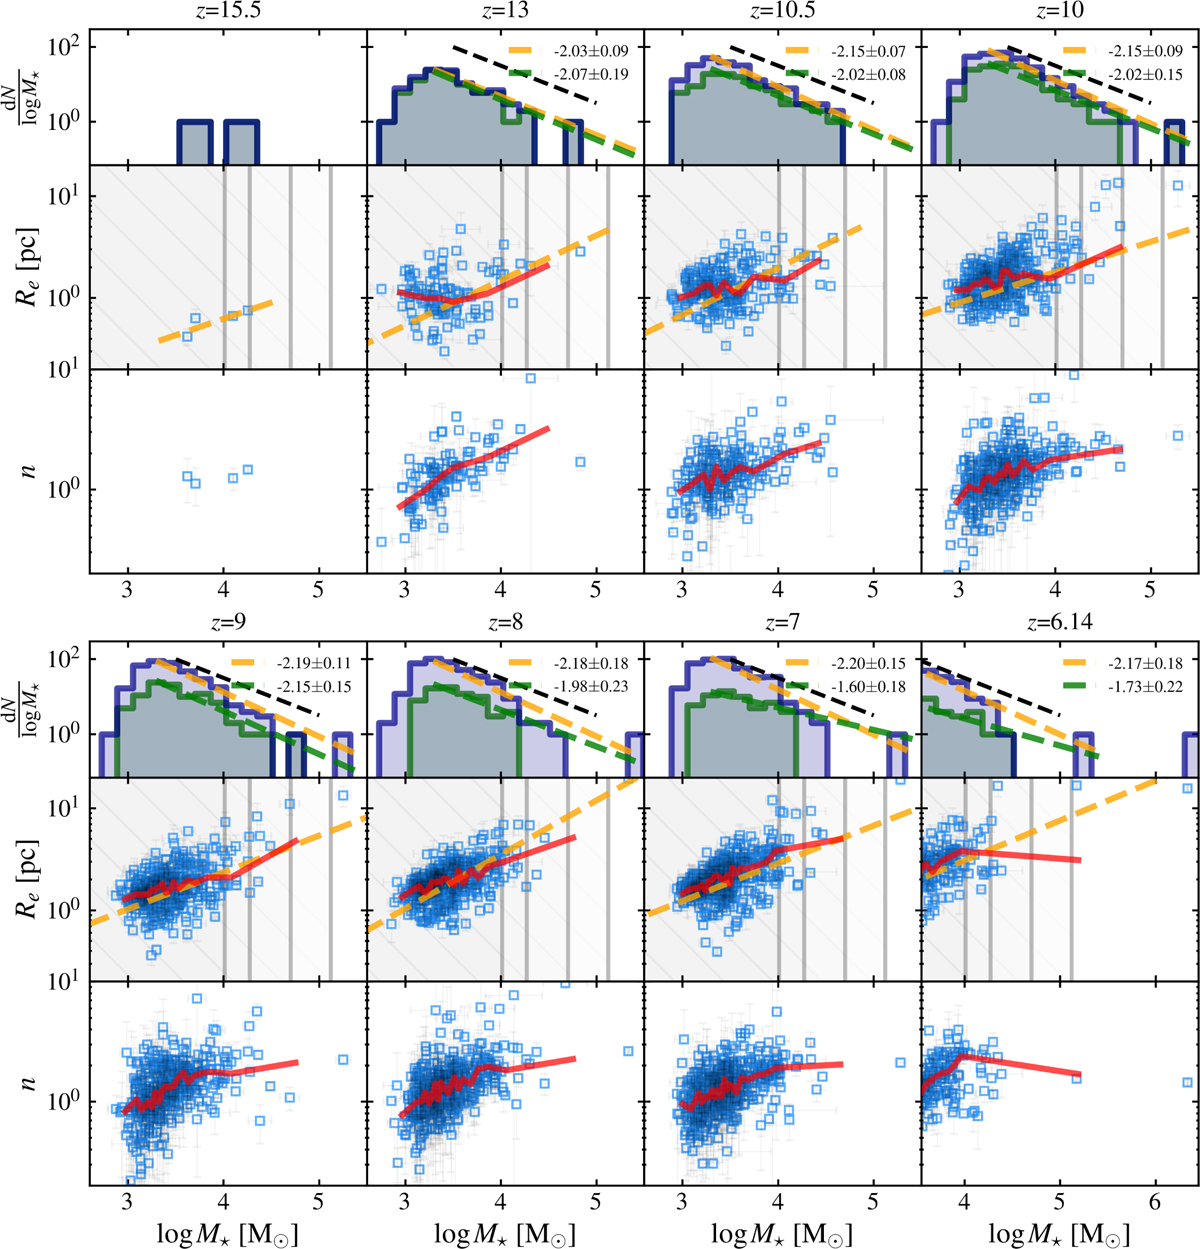
Scaling relations of clumps across redshifts. Top panels of each row: the CMF computed considering all (blue histogram) or only young (tage < 50 Myr, green histogram) clumps for the redshifts considered in this study. As a reference, the black dashed line indicates the ![]() relation, corresponding to a scale free spectrum of structure formation. The dashed orange line shows, instead, the fit to the high mass end of the CMF (log M⋆ [M⊙] > 3.25), with the resulting slope indicated in the top right corner of each panel. Central panels of each row: Size-mass relation as a function of redshift (blue points with error bars). In each panel, the orange dashed line corresponds to a linear fit to the data points. The grey vertical lines and bands represent the region of space where tdiss ≤ 13 Gyr, with tdiss as in Equation (12). Each line corresponds to a different assumption on RG in Equation (12), specifically, from left to right, RG = 18 kpc, 12 kpc, 6 kpc, and 3 kpc, while VG = 220 km s−1 to mimic the tidal field the clumps would experience if orbiting around a Milky Way like galaxy (see Section 5.5 for detail). Bottom panels of each row: relation between the clumps stellar mass and Sérsic index. In the central and bottom panels, the red solid curve connects the median Re and n for each log M⋆ bin. Note that the panels at z = 6.14 cover a different mass range than the others to highlight the presence of a massive clump with M⋆ ≃ 2 × 10⁶ M⊙.
relation, corresponding to a scale free spectrum of structure formation. The dashed orange line shows, instead, the fit to the high mass end of the CMF (log M⋆ [M⊙] > 3.25), with the resulting slope indicated in the top right corner of each panel. Central panels of each row: Size-mass relation as a function of redshift (blue points with error bars). In each panel, the orange dashed line corresponds to a linear fit to the data points. The grey vertical lines and bands represent the region of space where tdiss ≤ 13 Gyr, with tdiss as in Equation (12). Each line corresponds to a different assumption on RG in Equation (12), specifically, from left to right, RG = 18 kpc, 12 kpc, 6 kpc, and 3 kpc, while VG = 220 km s−1 to mimic the tidal field the clumps would experience if orbiting around a Milky Way like galaxy (see Section 5.5 for detail). Bottom panels of each row: relation between the clumps stellar mass and Sérsic index. In the central and bottom panels, the red solid curve connects the median Re and n for each log M⋆ bin. Note that the panels at z = 6.14 cover a different mass range than the others to highlight the presence of a massive clump with M⋆ ≃ 2 × 10⁶ M⊙.
Current usage metrics show cumulative count of Article Views (full-text article views including HTML views, PDF and ePub downloads, according to the available data) and Abstracts Views on Vision4Press platform.
Data correspond to usage on the plateform after 2015. The current usage metrics is available 48-96 hours after online publication and is updated daily on week days.
Initial download of the metrics may take a while.