Fig. 4
Download original image
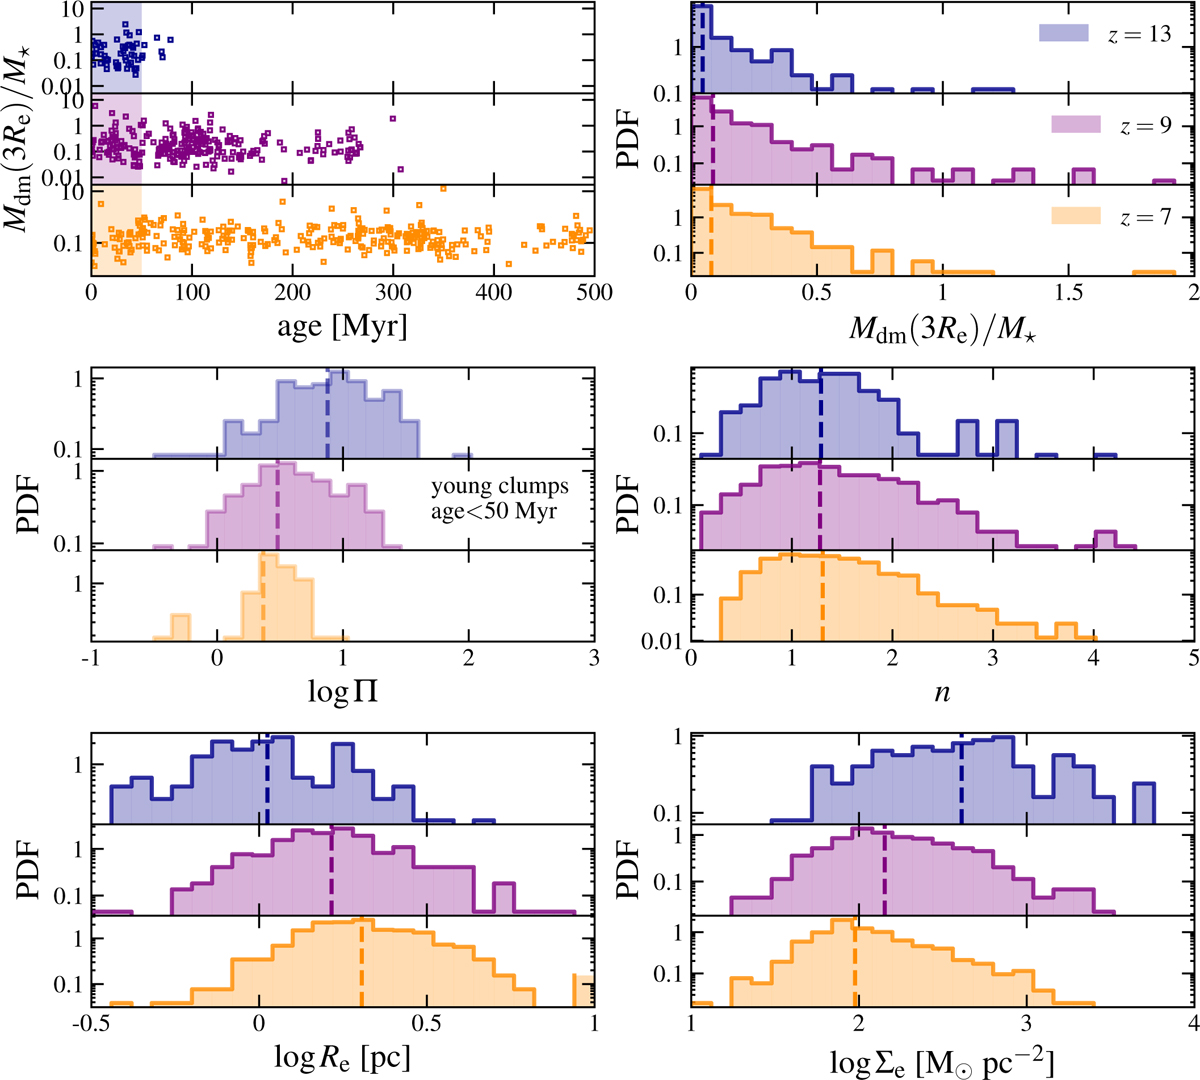
Clump parameters across redshifts. The triplets of panels illustrate: the relation between the dark-matter-to-stellar-mass ratio and clump ages (top-left), the distributions of the dark matter mass within three effective radii relative to the total stellar mass, Mdm (3Re)/M⋆ (top-right), the distributions of the boundedness parameter Π for clumps younger than 50 Myr (middle-left), the distributions of the effective radius Re (middle right), the distributions of the Sérsic index n (bottom left), and the distributions of the average surface density ![]() (bottom-right). Each panel within a triplet represents distributions at different redshifts, with z = 13 shown in blue (top), z = 9 in purple (middle), and z = 7 in orange (bottom). The colored bands in the top left triplet of panels highlight clumps younger than 50 Myr. These clumps are used to build the log Π distributions in the middle-left triplet of panels. For clarity, only three of the eight redshifts analyzed in this work are displayed. The vertical dashed line in all triplets (except for the top left) show the median value of the corresponding distribution.
(bottom-right). Each panel within a triplet represents distributions at different redshifts, with z = 13 shown in blue (top), z = 9 in purple (middle), and z = 7 in orange (bottom). The colored bands in the top left triplet of panels highlight clumps younger than 50 Myr. These clumps are used to build the log Π distributions in the middle-left triplet of panels. For clarity, only three of the eight redshifts analyzed in this work are displayed. The vertical dashed line in all triplets (except for the top left) show the median value of the corresponding distribution.
Current usage metrics show cumulative count of Article Views (full-text article views including HTML views, PDF and ePub downloads, according to the available data) and Abstracts Views on Vision4Press platform.
Data correspond to usage on the plateform after 2015. The current usage metrics is available 48-96 hours after online publication and is updated daily on week days.
Initial download of the metrics may take a while.