Fig. 3
Download original image
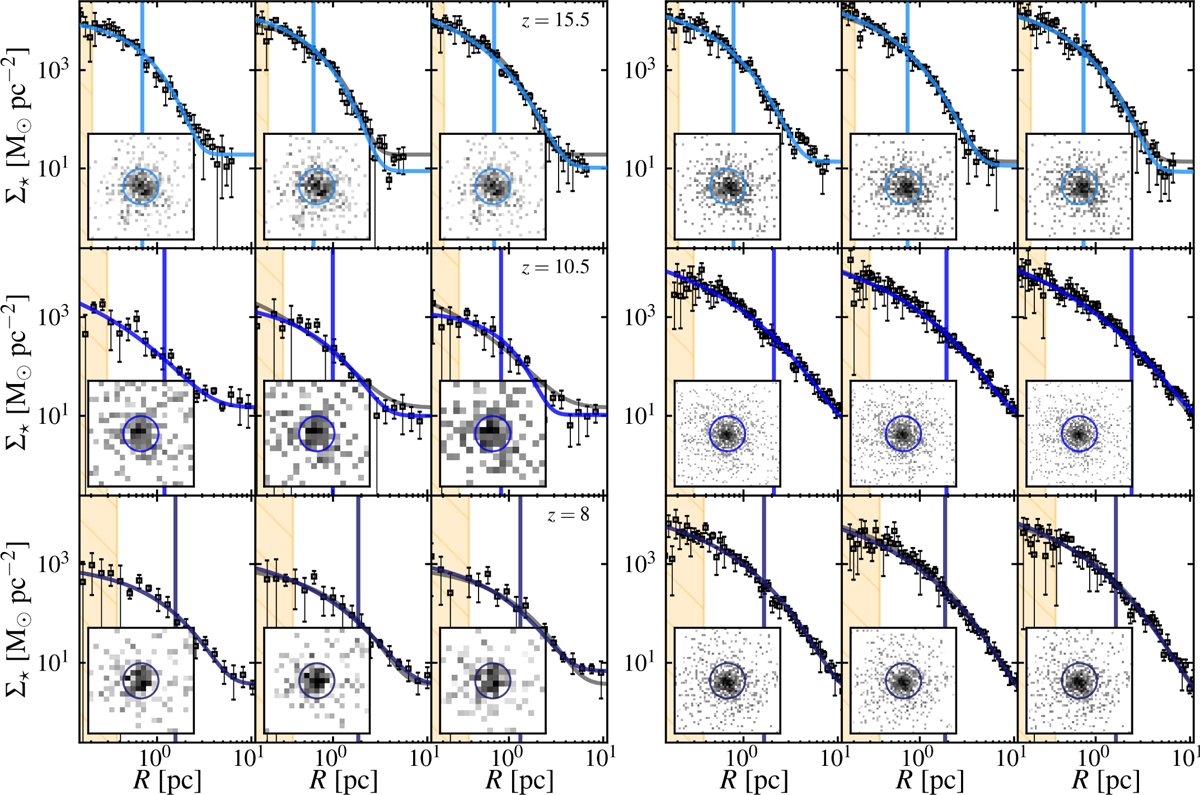
Clump projected density distributions. Top panels: projected stellar density profiles (black squares with errobars) for two clumps selected at z = 15.5. Each set of three panels shows the projected density along different lines of sight: along the z, y, and x axes from left to right, respectively (the x z plane is the plane of Fig. 1). The blue curves represent the best-fitting Sérsic + background models, while the vertical lines indicate the position of the effective radius, Re. In the middle and right panels of each triplet we added (with a grey line) the Sérsic + background model shown in the left panel to highlight differences among projections. The curves and the binned profiles shown are those obtained at the end of the two step fitting procedure (see Section 4). The small insets display the projected density map along the same direction as in the main panel, with the blue circle centered at center of the clump and having a radius equal to Re. The clump in the left panel has (M⋆, Re, n) = (1.25 × 10⁴ M⊙, 0.67 pc, 1.24), while the one in the right panel has (M⋆, Re, n) = (1.79 × 10⁴ M⊙, 0.76 pc, 1.47). Middle panels: same as the top panels, but for clumps at z = 10.5. The clumps have (M⋆, Re, n) = (2.88 × 10³ M⊙, 1.00 pc, 1.63) – left – and (M⋆, Re, n) = (3.04 × 10⁴, 2.13 pc, 2.69) – right. Bottom panels: Same as the top and middle panels, but for clumps at z = 8, with (M⋆, Re, n) = (3.03 × 10³ M⊙, 1.57 pc, 1.62), and (M⋆, Re, n) = (1.83 × 10⁴ M⊙, 1.71 pc, 2.27) on the right. In each panel, the orange shaded area shows the simulation resolution (Δx) at that redshift, Δx ≡ 5h−1/[2l(1 + z)], with l = 21 and h = 0.703.
Current usage metrics show cumulative count of Article Views (full-text article views including HTML views, PDF and ePub downloads, according to the available data) and Abstracts Views on Vision4Press platform.
Data correspond to usage on the plateform after 2015. The current usage metrics is available 48-96 hours after online publication and is updated daily on week days.
Initial download of the metrics may take a while.