Fig. 2
Download original image
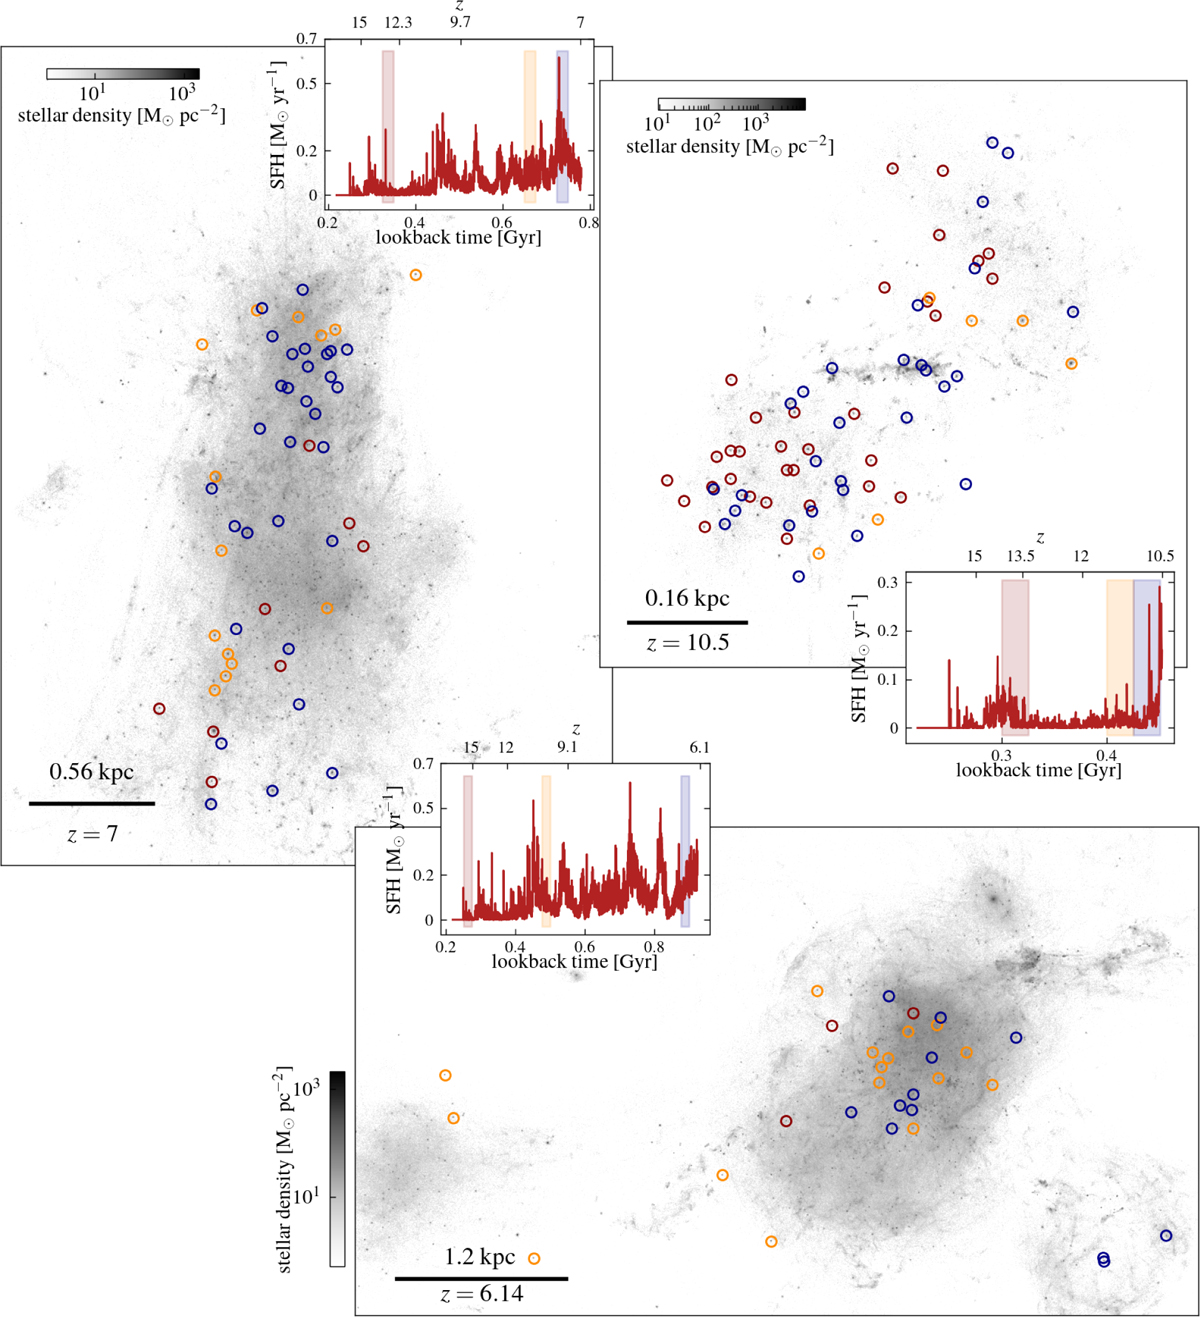
Examples of stellar density distributions of star-forming regions taken at three different redshifts. The top-right, top-left, and lower maps correspond to z = 10.5,7, and 6.14, respectively. The star-forming systems shown in the top-right and top-left panels correspond to the stellar counterparts of the most massive halos visible in the top and bottom panels of Fig. 1. In each panel, the small insets display the star formation histories of the corresponding regions. All clumps identified within the time windows color-coded in the small insets are marked with circles and displayed with the same colors on the corresponding projected stellar density map.
Current usage metrics show cumulative count of Article Views (full-text article views including HTML views, PDF and ePub downloads, according to the available data) and Abstracts Views on Vision4Press platform.
Data correspond to usage on the plateform after 2015. The current usage metrics is available 48-96 hours after online publication and is updated daily on week days.
Initial download of the metrics may take a while.