Fig. 1
Download original image
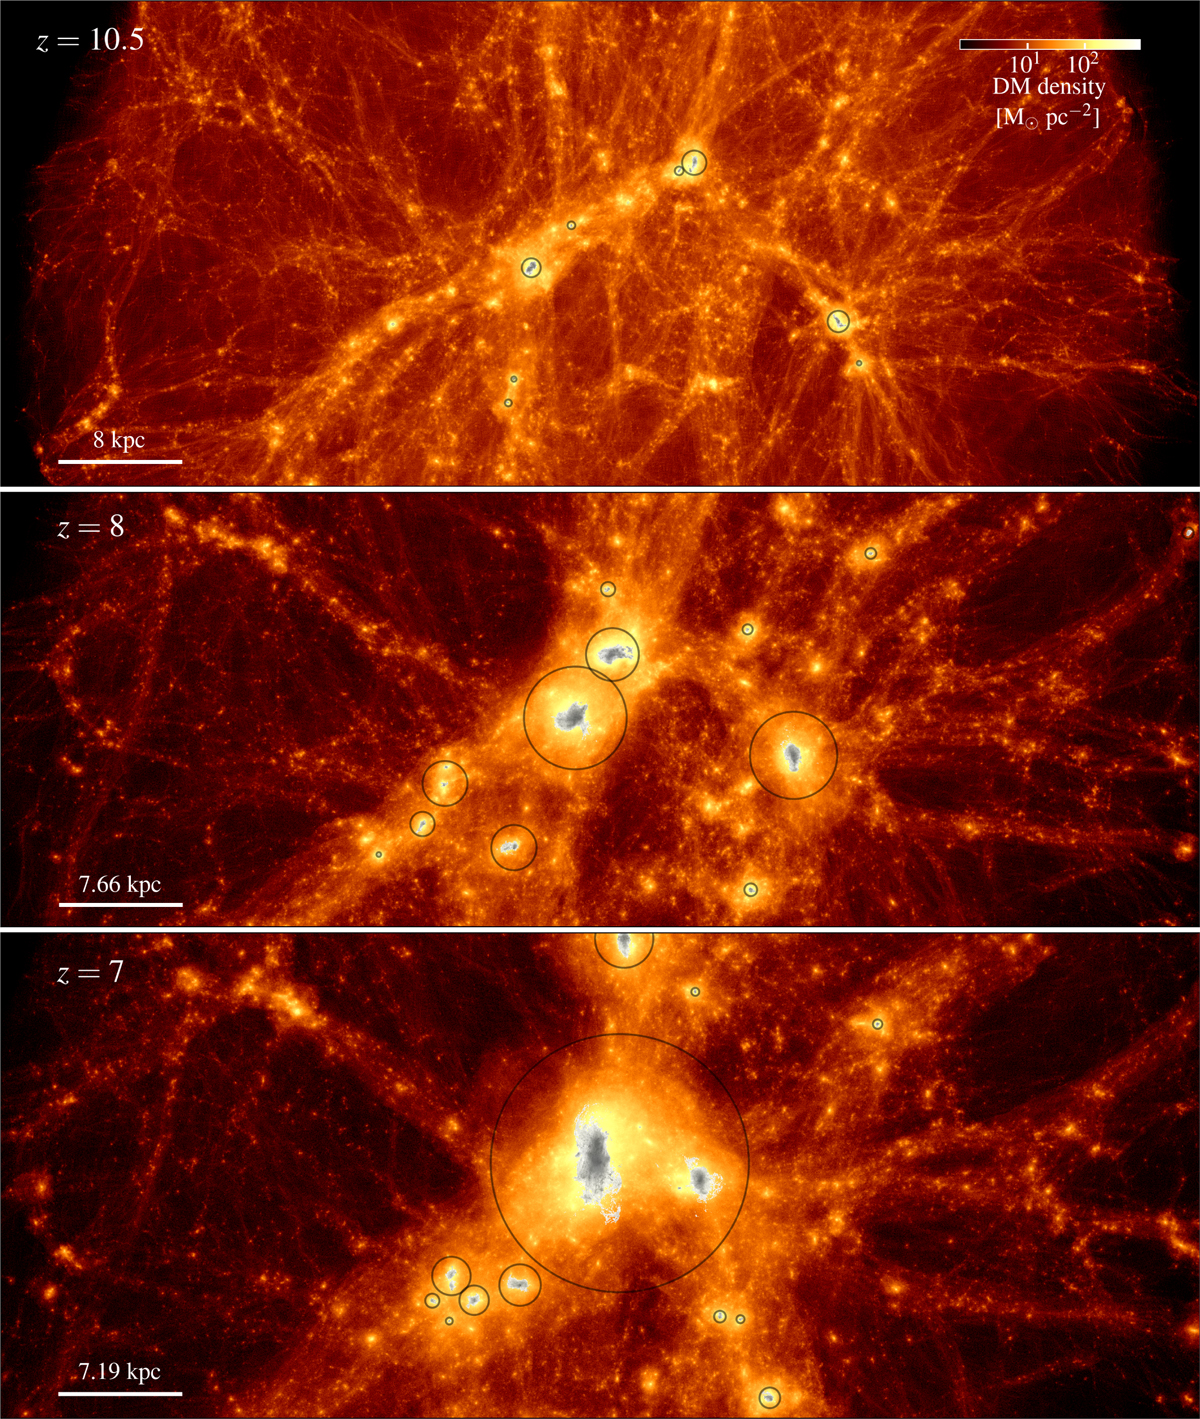
Evolution with redshift of the projected dark matter density within the high-resolution simulation domain. Top, middle, and bottom panels show the projected dark matter density distribution in the central region of the simulation box at a redshift of z = 10.5, 8, and 7, respectively. In all panels, brighter colors indicate higher-density regions. The stellar projected density maps corresponding to the same regions are overlaid for comparison, allowing for a visual examination of the relationship between dark matter and stellar structures across different cosmic epochs. The stellar clumps formed have been highlighted with black circles.
Current usage metrics show cumulative count of Article Views (full-text article views including HTML views, PDF and ePub downloads, according to the available data) and Abstracts Views on Vision4Press platform.
Data correspond to usage on the plateform after 2015. The current usage metrics is available 48-96 hours after online publication and is updated daily on week days.
Initial download of the metrics may take a while.