Fig. 9.
Download original image
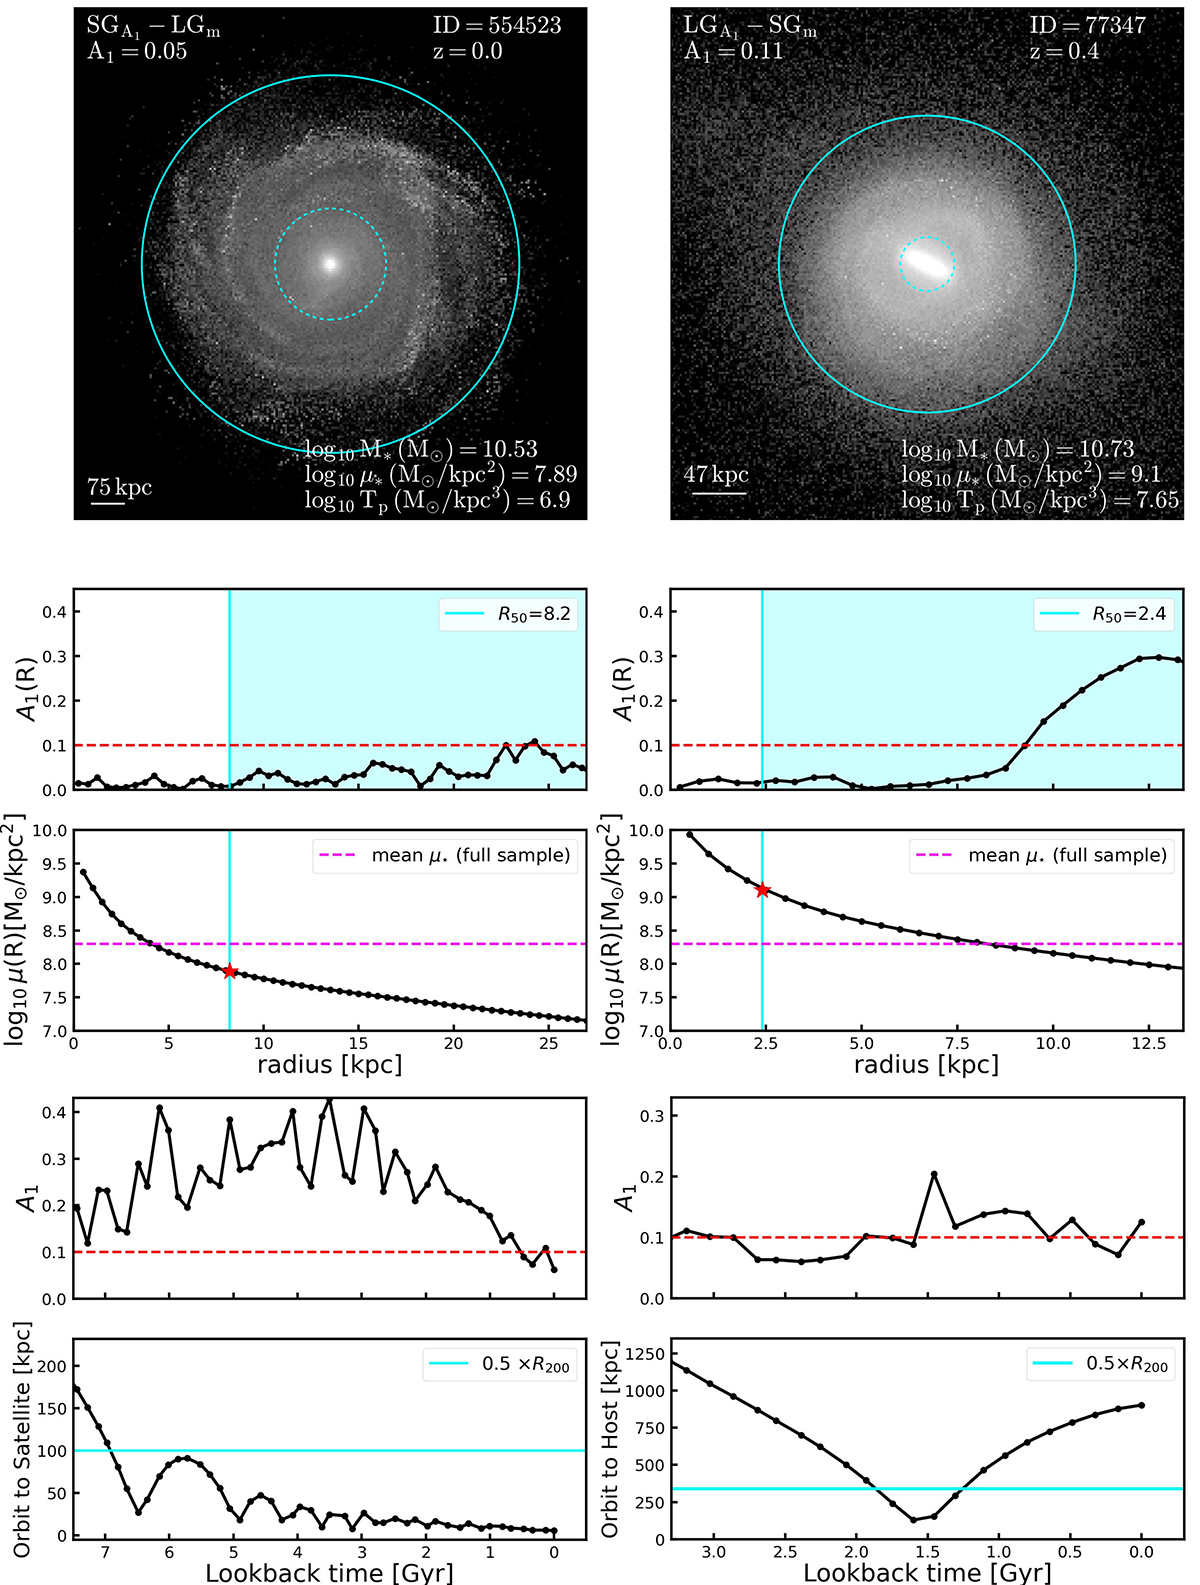
Top panels: V-band face-on projected surface brightness distribution of a (left) symmetric galaxy pre-classified as lopsided ![]() and a (right) lopsided galaxy pre-classified as symmetric
and a (right) lopsided galaxy pre-classified as symmetric ![]() , considered as examples of the misclassification made by SMOTE + RF. On the upper side, their respective A1 value and classification case are plotted on the left, and their ID and redshift z on the right. On the bottom right, the values of the stellar mass (M*), central stellar mass density (μ*), and tidal parameter (TP) are plotted. The dashed cyan lines represent the inner radius R50 and the solid cyan lines represent the outer radius 1.4R90, which are the limits of the radial interval used in the Fourier decomposition. Middle panels: Lopsidedness and stellar density profiles with respect to the radius, up to 1.4R90. In both cases, the cyan lines represent the start of the radial interval, R50. The dashed pink lines represent the average central stellar mass density (μ*) of the full sample, with a value of 8.3, while the red stars represent the value of the cental stellar mass density of the galaxy, μ*, within R50. Bottom panels: Lopsidedness and the respective orbit of the most massive satellite with respect to lookback time. The dashed red line represents the A1 threshold to classify lopsided and symmetric galaxies. The horizontal cyan line represents 0.5 × R200, where R200 is defined as the virial radius of the central galaxy.
, considered as examples of the misclassification made by SMOTE + RF. On the upper side, their respective A1 value and classification case are plotted on the left, and their ID and redshift z on the right. On the bottom right, the values of the stellar mass (M*), central stellar mass density (μ*), and tidal parameter (TP) are plotted. The dashed cyan lines represent the inner radius R50 and the solid cyan lines represent the outer radius 1.4R90, which are the limits of the radial interval used in the Fourier decomposition. Middle panels: Lopsidedness and stellar density profiles with respect to the radius, up to 1.4R90. In both cases, the cyan lines represent the start of the radial interval, R50. The dashed pink lines represent the average central stellar mass density (μ*) of the full sample, with a value of 8.3, while the red stars represent the value of the cental stellar mass density of the galaxy, μ*, within R50. Bottom panels: Lopsidedness and the respective orbit of the most massive satellite with respect to lookback time. The dashed red line represents the A1 threshold to classify lopsided and symmetric galaxies. The horizontal cyan line represents 0.5 × R200, where R200 is defined as the virial radius of the central galaxy.
Current usage metrics show cumulative count of Article Views (full-text article views including HTML views, PDF and ePub downloads, according to the available data) and Abstracts Views on Vision4Press platform.
Data correspond to usage on the plateform after 2015. The current usage metrics is available 48-96 hours after online publication and is updated daily on week days.
Initial download of the metrics may take a while.