Fig. 8.
Download original image
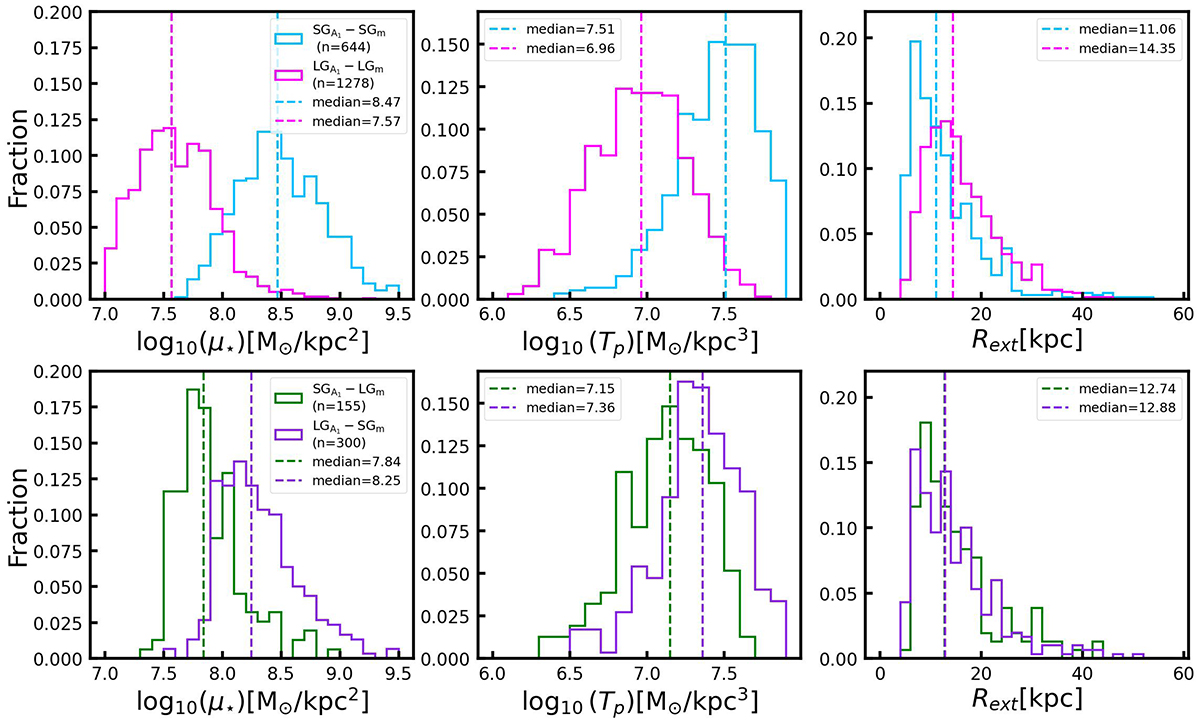
Normalized distribution of μ*(left), TP(middle), and Rext(right), considering the correct (upper) and incorrect (bottom) classification made by SMOTE + RF. Each distribution has been normalized by their corresponding number of galaxies of each subsample. Their respective number of galaxies is in parenthesis. The fuchsia and blue distributions represent the correctly classified lopsided galaxies ![]() and symmetric galaxies
and symmetric galaxies ![]() , respectively. The green distribution represents symmetric galaxies pre-classified as lopsided
, respectively. The green distribution represents symmetric galaxies pre-classified as lopsided ![]() and the purple distribution represents lopsided galaxies pre-classified as symmetric
and the purple distribution represents lopsided galaxies pre-classified as symmetric ![]() . The dashed lines represent the median of their respective distribution.
. The dashed lines represent the median of their respective distribution.
Current usage metrics show cumulative count of Article Views (full-text article views including HTML views, PDF and ePub downloads, according to the available data) and Abstracts Views on Vision4Press platform.
Data correspond to usage on the plateform after 2015. The current usage metrics is available 48-96 hours after online publication and is updated daily on week days.
Initial download of the metrics may take a while.