Fig. 7.
Download original image
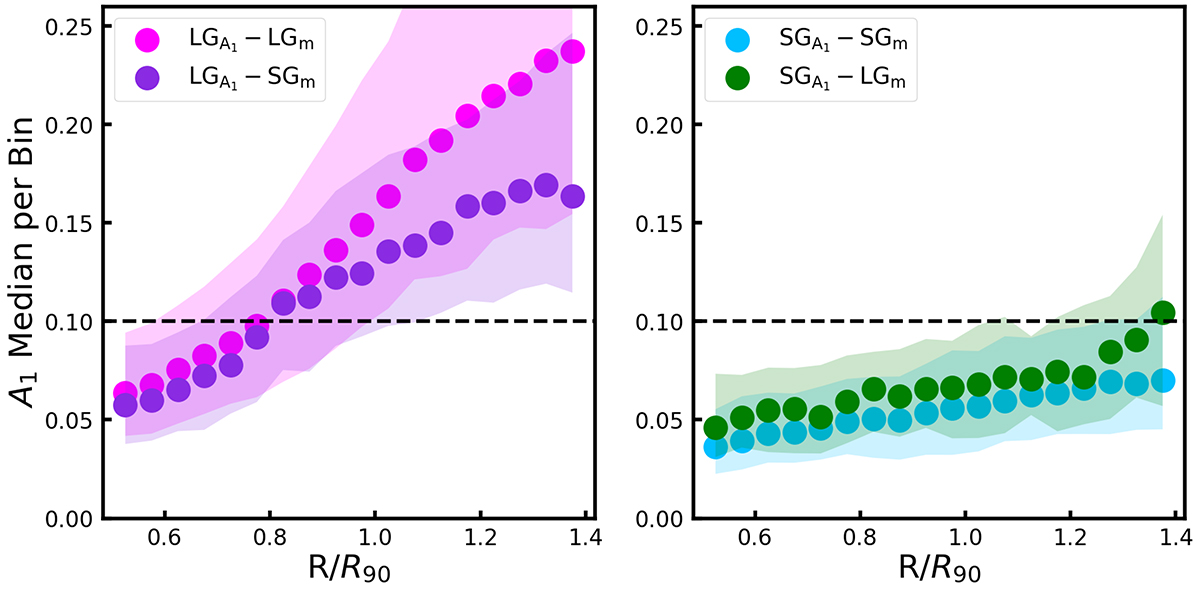
Radial profiles of A1 for our four classification cases, calculated as the median of A1 for each bin with respect to R90. The fuchsia and blue distributions represent the correctly classified lopsided galaxies ![]() and symmetric galaxies
and symmetric galaxies ![]() , respectively. The green distribution represents symmetric galaxies pre-classified as lopsided
, respectively. The green distribution represents symmetric galaxies pre-classified as lopsided ![]() and the purple distribution represents lopsided galaxies pre-classified as symmetric
and the purple distribution represents lopsided galaxies pre-classified as symmetric ![]() . The shaded areas represent the 25th and 75th percentiles of each sample.
. The shaded areas represent the 25th and 75th percentiles of each sample.
Current usage metrics show cumulative count of Article Views (full-text article views including HTML views, PDF and ePub downloads, according to the available data) and Abstracts Views on Vision4Press platform.
Data correspond to usage on the plateform after 2015. The current usage metrics is available 48-96 hours after online publication and is updated daily on week days.
Initial download of the metrics may take a while.