Open Access
Fig. 4.
Download original image
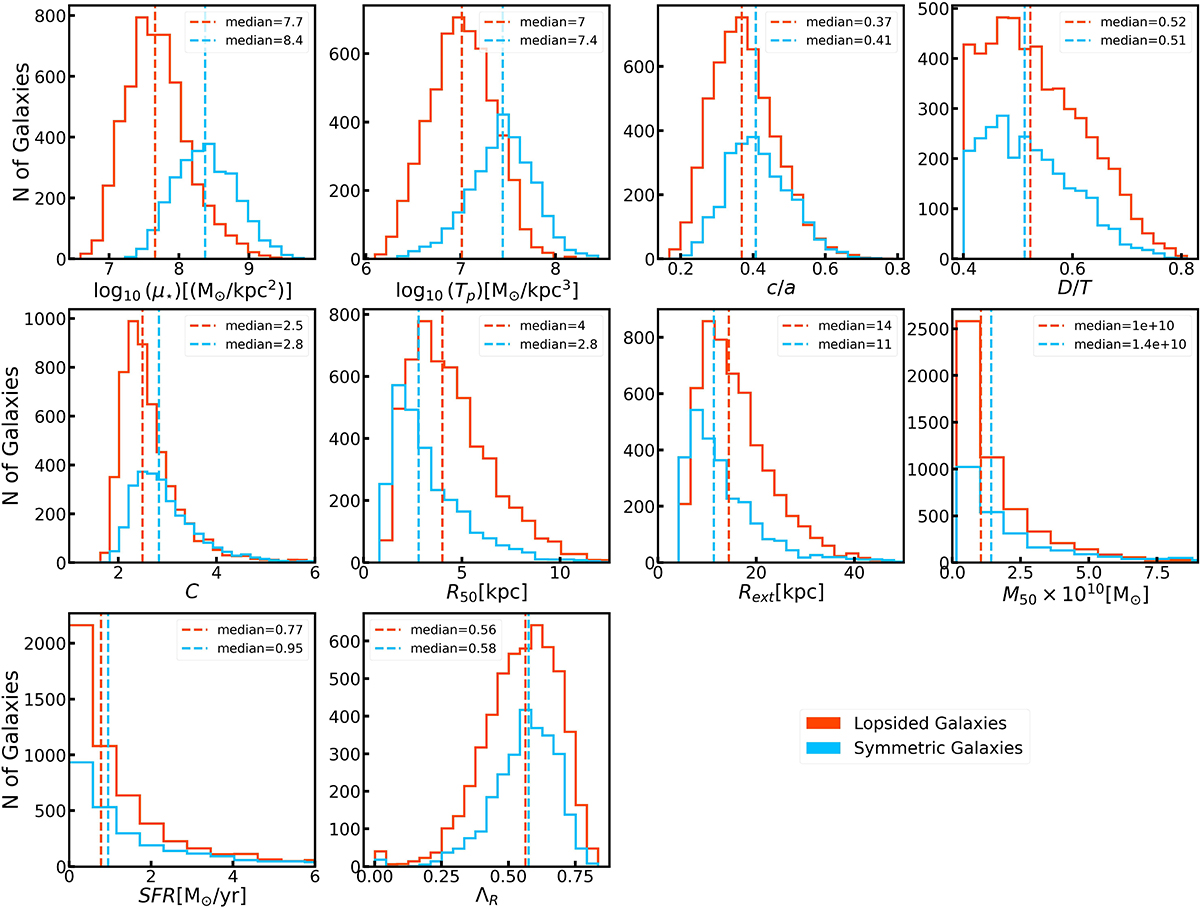
Distribution of parameters selected to characterize our galaxy sample. These parameters are used as features by the random forest classifier. The orange and blue distributions represent lopsided and symmetric galaxies, respectively. The dashed colored lines represent their respective median.
Current usage metrics show cumulative count of Article Views (full-text article views including HTML views, PDF and ePub downloads, according to the available data) and Abstracts Views on Vision4Press platform.
Data correspond to usage on the plateform after 2015. The current usage metrics is available 48-96 hours after online publication and is updated daily on week days.
Initial download of the metrics may take a while.