Fig. 3.
Download original image
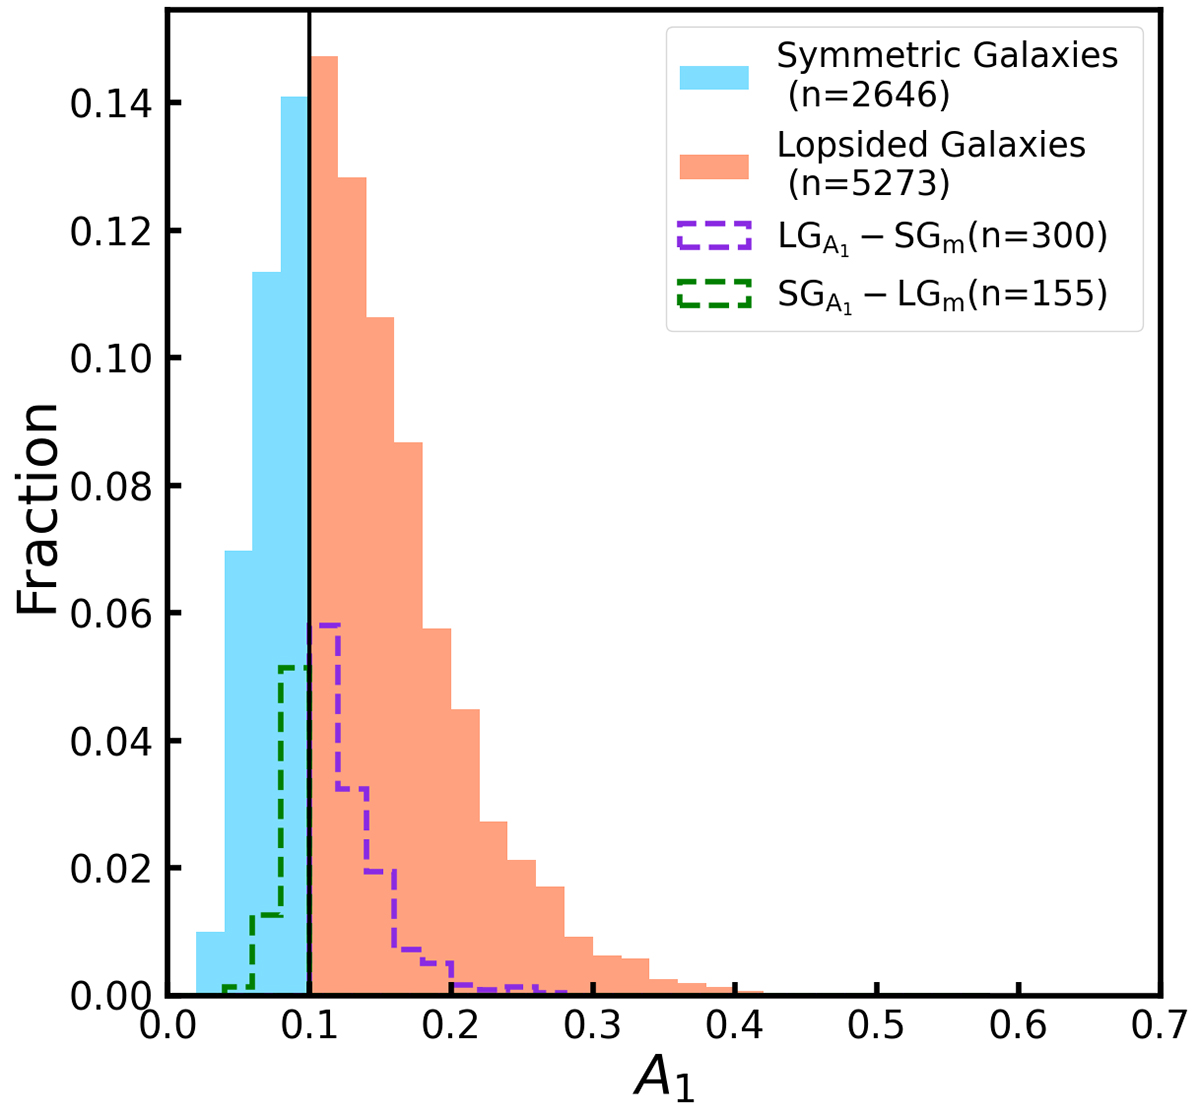
A1 distribution of our total sample. A1 is defined as the averaged strength of the m = 1 mode of the Fourier decomposition for each stellar particle within the radial range R50 − 1.4R90. The black line represents the threshold used to distinguish between lopsided (orange) and symmetric galaxies (blue). The dashed distributions represent the incorrect classifications of the galaxies made by SMOTE + RF for testing set, as we discuss later in Sect. 4. The dashed purple distribution represents the actual symmetric galaxies classified by the model as lopsided galaxies ![]() , and the dashed green distribution represents the actual lopsided galaxies classified by the model as symmetric galaxies
, and the dashed green distribution represents the actual lopsided galaxies classified by the model as symmetric galaxies ![]() . Each distribution has in parenthesis their respective number.
. Each distribution has in parenthesis their respective number.
Current usage metrics show cumulative count of Article Views (full-text article views including HTML views, PDF and ePub downloads, according to the available data) and Abstracts Views on Vision4Press platform.
Data correspond to usage on the plateform after 2015. The current usage metrics is available 48-96 hours after online publication and is updated daily on week days.
Initial download of the metrics may take a while.