Fig. 2.
Download original image
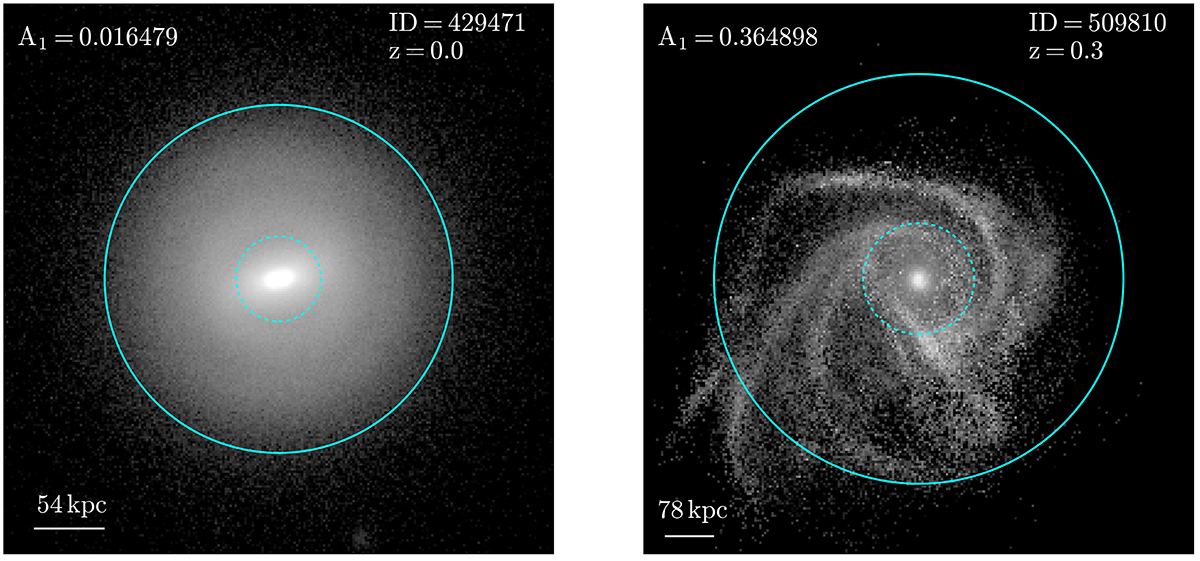
V-band face-on projected surface brightness distribution of a symmetric (left) and lopsided (right) galaxy, considered as examples of the classification made by A1. Their respective A1 value, ID (as in TNG50-1), and redshift snapshot are plotted on the upper side. On the lower left, the box size considered for each galaxy is also plotted. For both images, the dashed cyan line represents the radius R50 and the solid cyan line represents the radius 1.4R90, which are the limits of the radial interval used in the Fourier decomposition.
Current usage metrics show cumulative count of Article Views (full-text article views including HTML views, PDF and ePub downloads, according to the available data) and Abstracts Views on Vision4Press platform.
Data correspond to usage on the plateform after 2015. The current usage metrics is available 48-96 hours after online publication and is updated daily on week days.
Initial download of the metrics may take a while.