Fig. 10.
Download original image
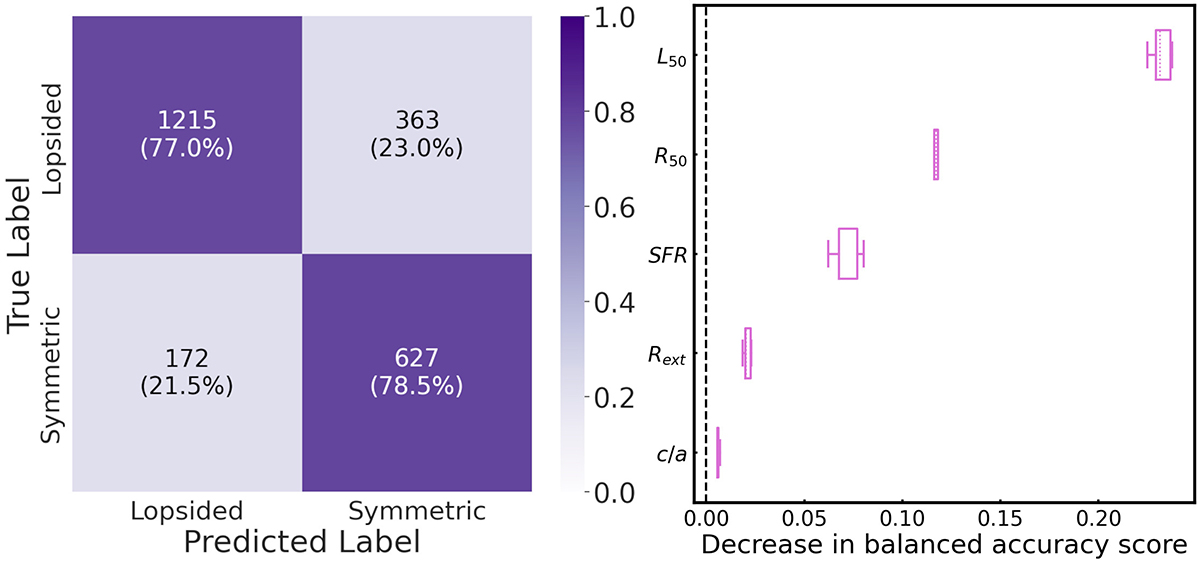
Left: Confusion matrix of the testing set using SMOTE + RF with only observational parameters. The x axis is the predicted class or predicted label, and the y axis is the actual class or actual label. The percentage with respect each class is on parenthesis. Right: Box plot of each observational feature from the testing set, ranked by their importance as determined by the feature permutation attribute from SMOTE + RF. Each box represents the range of the different scores obtained from a cross-validation with niter = 5. The inner dashed line represents the median value of each distribution. The whiskers on each box represent the minimum and maximum value of each distribution.
Current usage metrics show cumulative count of Article Views (full-text article views including HTML views, PDF and ePub downloads, according to the available data) and Abstracts Views on Vision4Press platform.
Data correspond to usage on the plateform after 2015. The current usage metrics is available 48-96 hours after online publication and is updated daily on week days.
Initial download of the metrics may take a while.