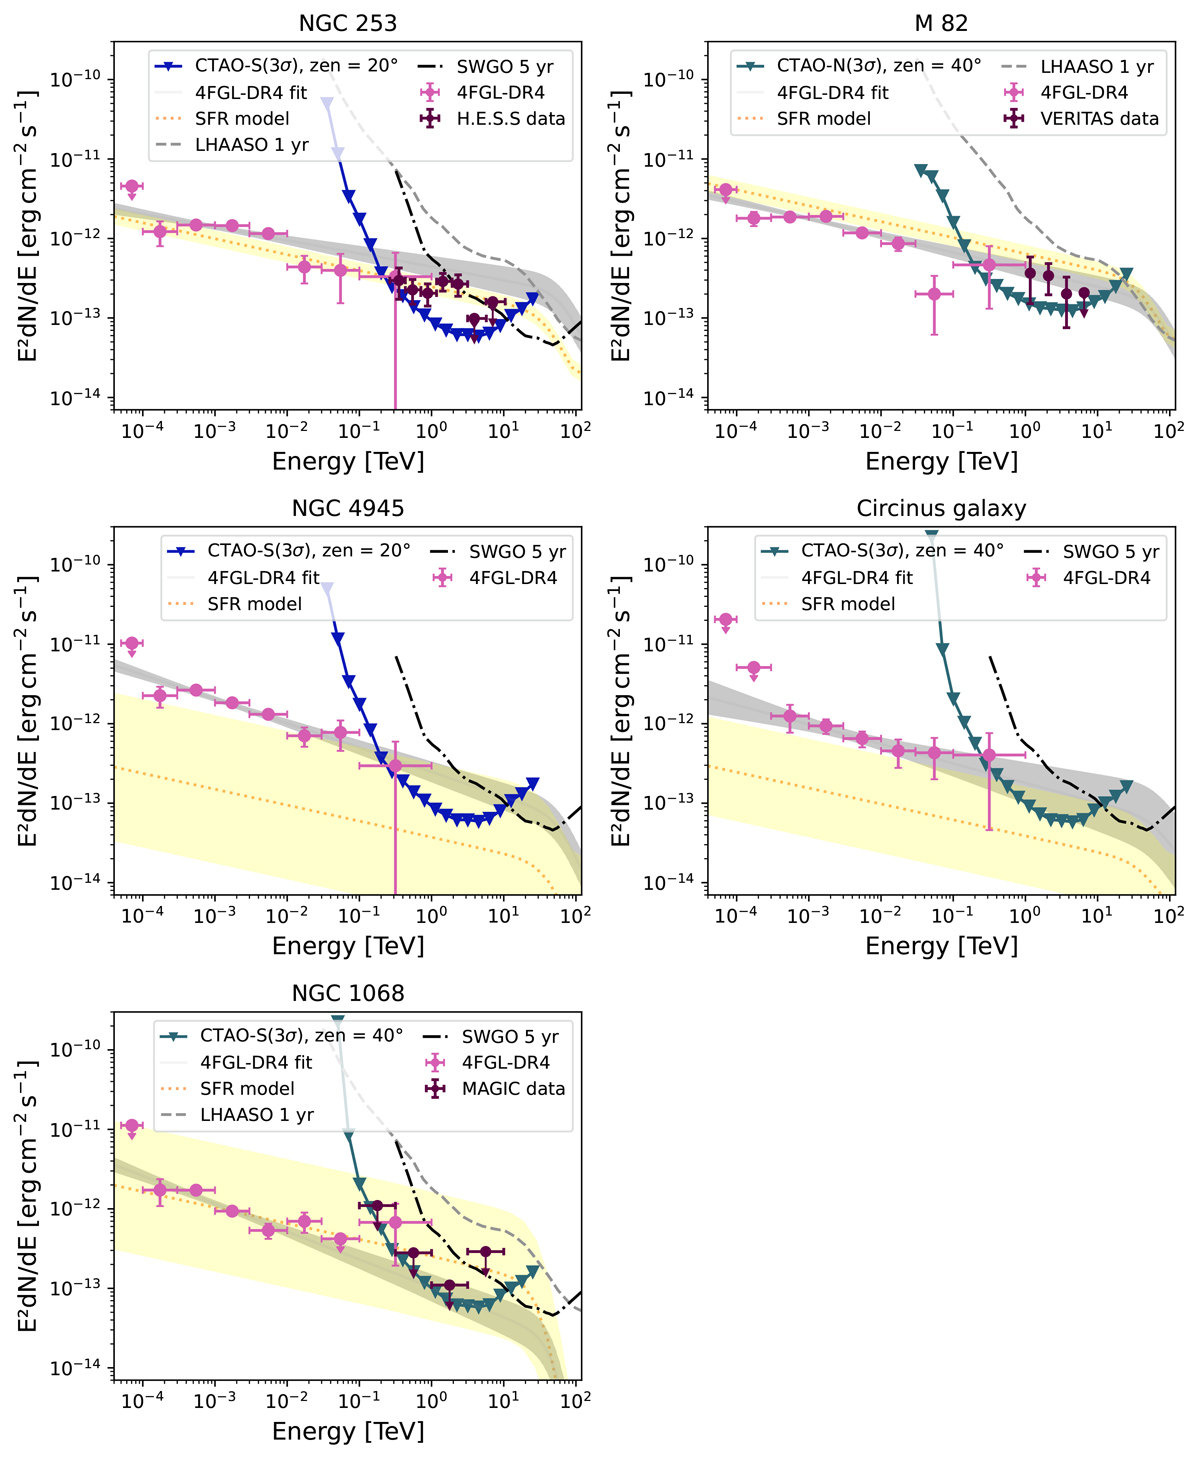
Fig. 2.
Download original image
SEDs of the top candidates selected from the GeV-detected sample of SFGs. In each panel, pink dots denote spectral points from Fermi-LAT, the gray line and gray shaded region represent the best power-law fit to the γ-ray data, as provided in the 4FGL-DR4 catalog, including absorption on the EBL at multi-TeV energies. The orange dotted line and associated shaded region depict the empirical model scaled to the SFR of the galaxy, along with its associated uncertainty. The line defined by the triangles indicates the 3σ-level point-source sensitivity of the CTAO in 50 h. The dashed gray line and dotted-dashed black line show the LHAASO and SWGO sensitivities, respectively. VHE data and upper limits for NGC 253, M82, and NGC 1068 were taken from H.E.S.S. Collaboration (2018), VERITAS Collaboration (2009) and Acciari et al. (2019), respectively.
Current usage metrics show cumulative count of Article Views (full-text article views including HTML views, PDF and ePub downloads, according to the available data) and Abstracts Views on Vision4Press platform.
Data correspond to usage on the plateform after 2015. The current usage metrics is available 48-96 hours after online publication and is updated daily on week days.
Initial download of the metrics may take a while.