Fig. 1.
Download original image
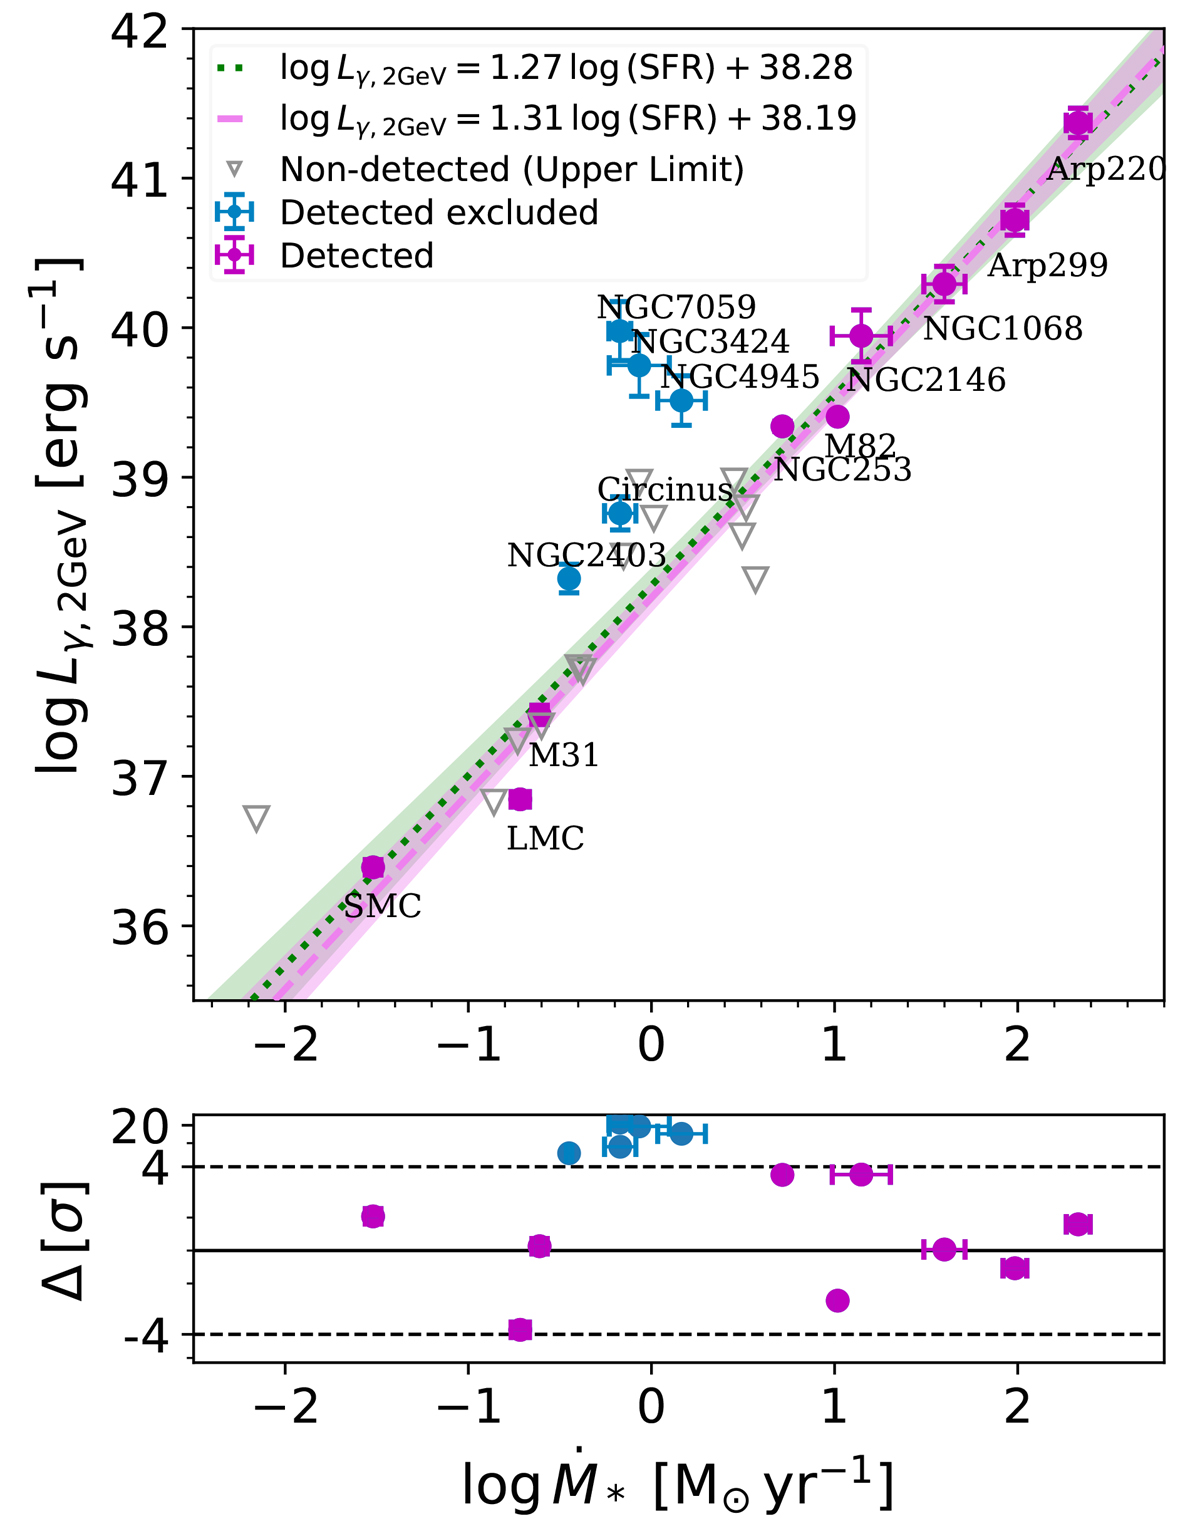
Upper panel: Lγ, 2 GeV – SFR observed correlation. The dotted green line corresponds to the best-fit model for all the data points of detected SFGs and the shaded region represents the 68% confidence level band. The dashed pink line and associated shaded region show the best-fit model excluding blue markers. The upper limits obtained in Section 2.1, shown as downward-pointing triangles, are not taken into account in the fit. Lower panel: Residuals to the fit excluding blue markers normalized to their standard deviation. The dashed black lines correspond to 4 standard deviations.
Current usage metrics show cumulative count of Article Views (full-text article views including HTML views, PDF and ePub downloads, according to the available data) and Abstracts Views on Vision4Press platform.
Data correspond to usage on the plateform after 2015. The current usage metrics is available 48-96 hours after online publication and is updated daily on week days.
Initial download of the metrics may take a while.