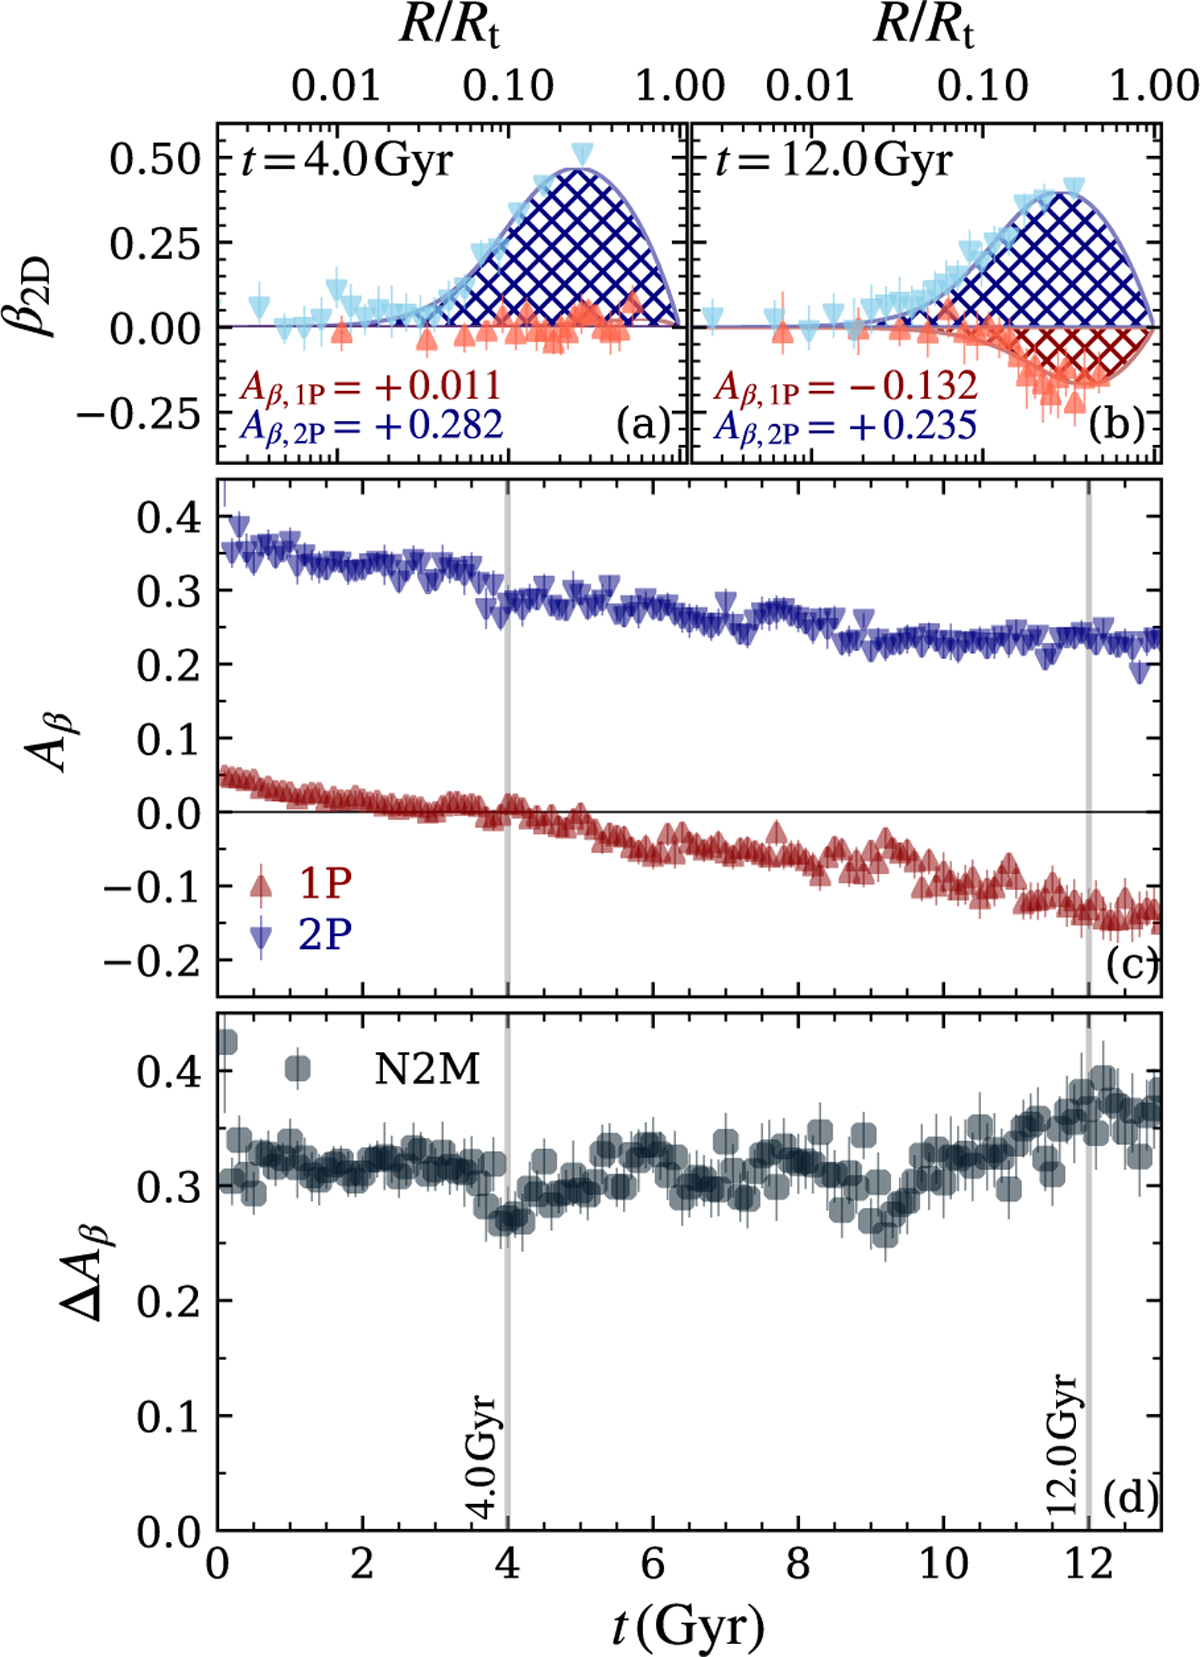
Fig. 7
Download original image
Velocity anisotropy area (Aβ) and area difference (ΔAβ) for the N2M model. Panels a and b show the velocity anisotropy for the two populations (red upper triangles, PO1P, and downwards blue triangles, PO2P) in the N2M model at 4 Gyr and 12 Gyr, respectively. The hatched regions represent the respective anisotropy area for each population from the best-fit velocity dispersion and anisotropy parameterisation (see main text). Panel c shows the evolution of the anisotropy areas for the two populations over time; as the 2P becomes less radially anisotropic, the 1P becomes tangentially anisotropic and keeps a constant difference with the 2P, as shown in panel d, where we show the evolution of the anisotropy area difference. The vertical lines in panels c and d represent the times for which we show the velocity anisotropy profiles in panels a and b.
Current usage metrics show cumulative count of Article Views (full-text article views including HTML views, PDF and ePub downloads, according to the available data) and Abstracts Views on Vision4Press platform.
Data correspond to usage on the plateform after 2015. The current usage metrics is available 48-96 hours after online publication and is updated daily on week days.
Initial download of the metrics may take a while.