Fig. 6
Download original image
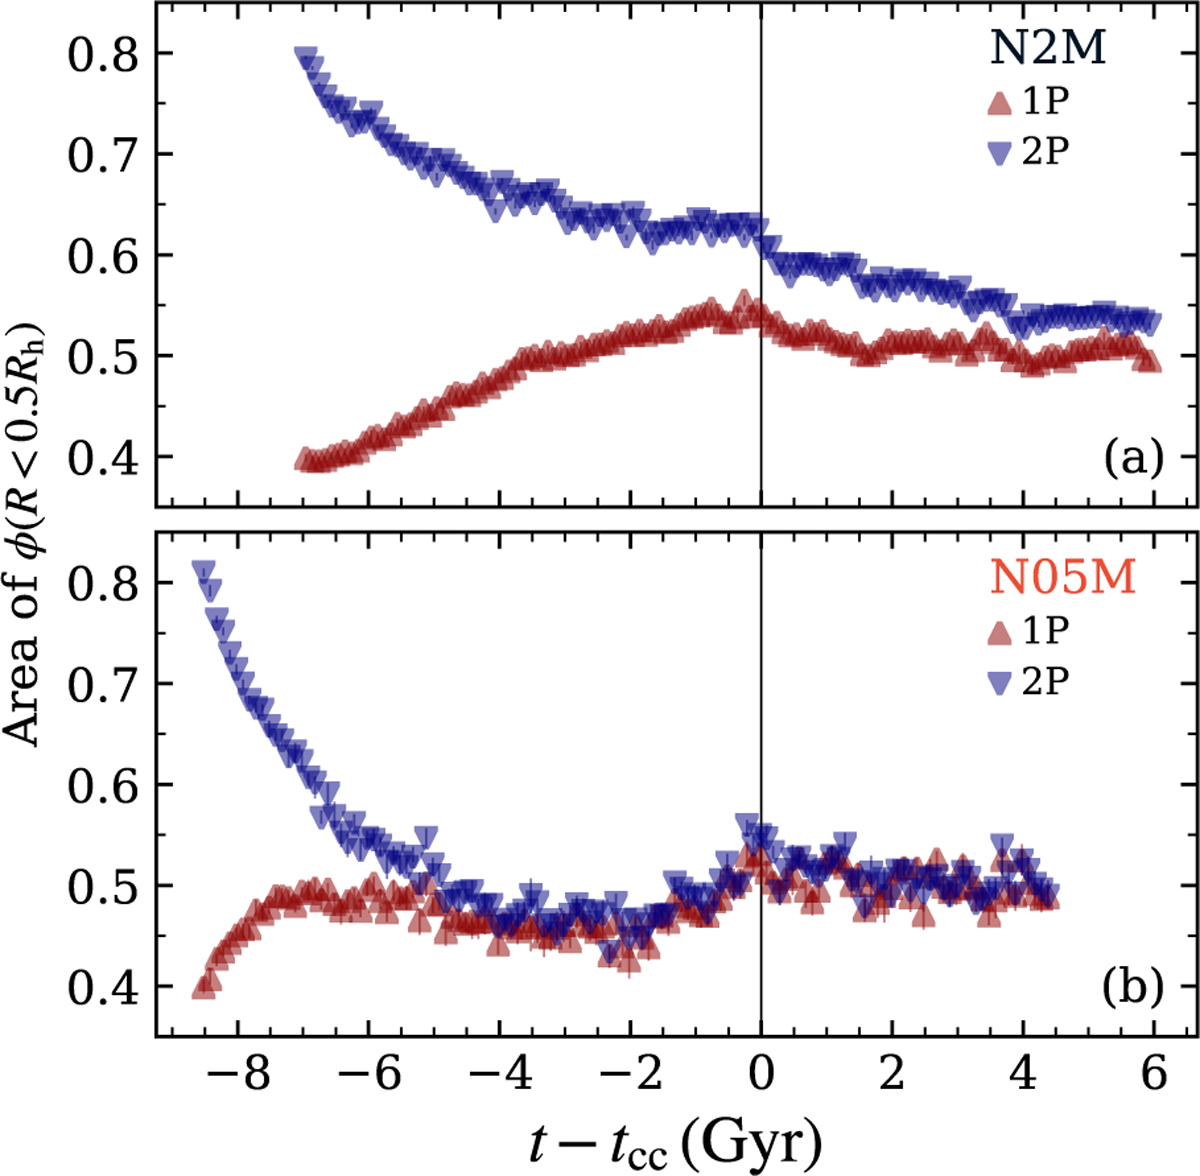
Area of the cumulative stellar distribution within 0.5Rh (ϕ(<0.5Rh)) for the two populations in models: (a) N2M and (b) N05M. As in Fig. 3, we centre the time evolution at the respective time of the first core collapse. The two populations in model N2M have not achieved complete spatial mixing and ϕ2P(R < 0.5Rh) > ϕ1P(R < 0.5Rh). The model N05M has already attained a significant spatial mixing and ϕ2P(R < 0.5Rh) ~ ϕ1P(R < 0.5Rh). Furthermore, for model N05M, both populations show the same rate of increased concentration at core collapse, which explains the lack of signatures in S2(E) (see Fig. 3).
Current usage metrics show cumulative count of Article Views (full-text article views including HTML views, PDF and ePub downloads, according to the available data) and Abstracts Views on Vision4Press platform.
Data correspond to usage on the plateform after 2015. The current usage metrics is available 48-96 hours after online publication and is updated daily on week days.
Initial download of the metrics may take a while.