Fig. 5
Download original image
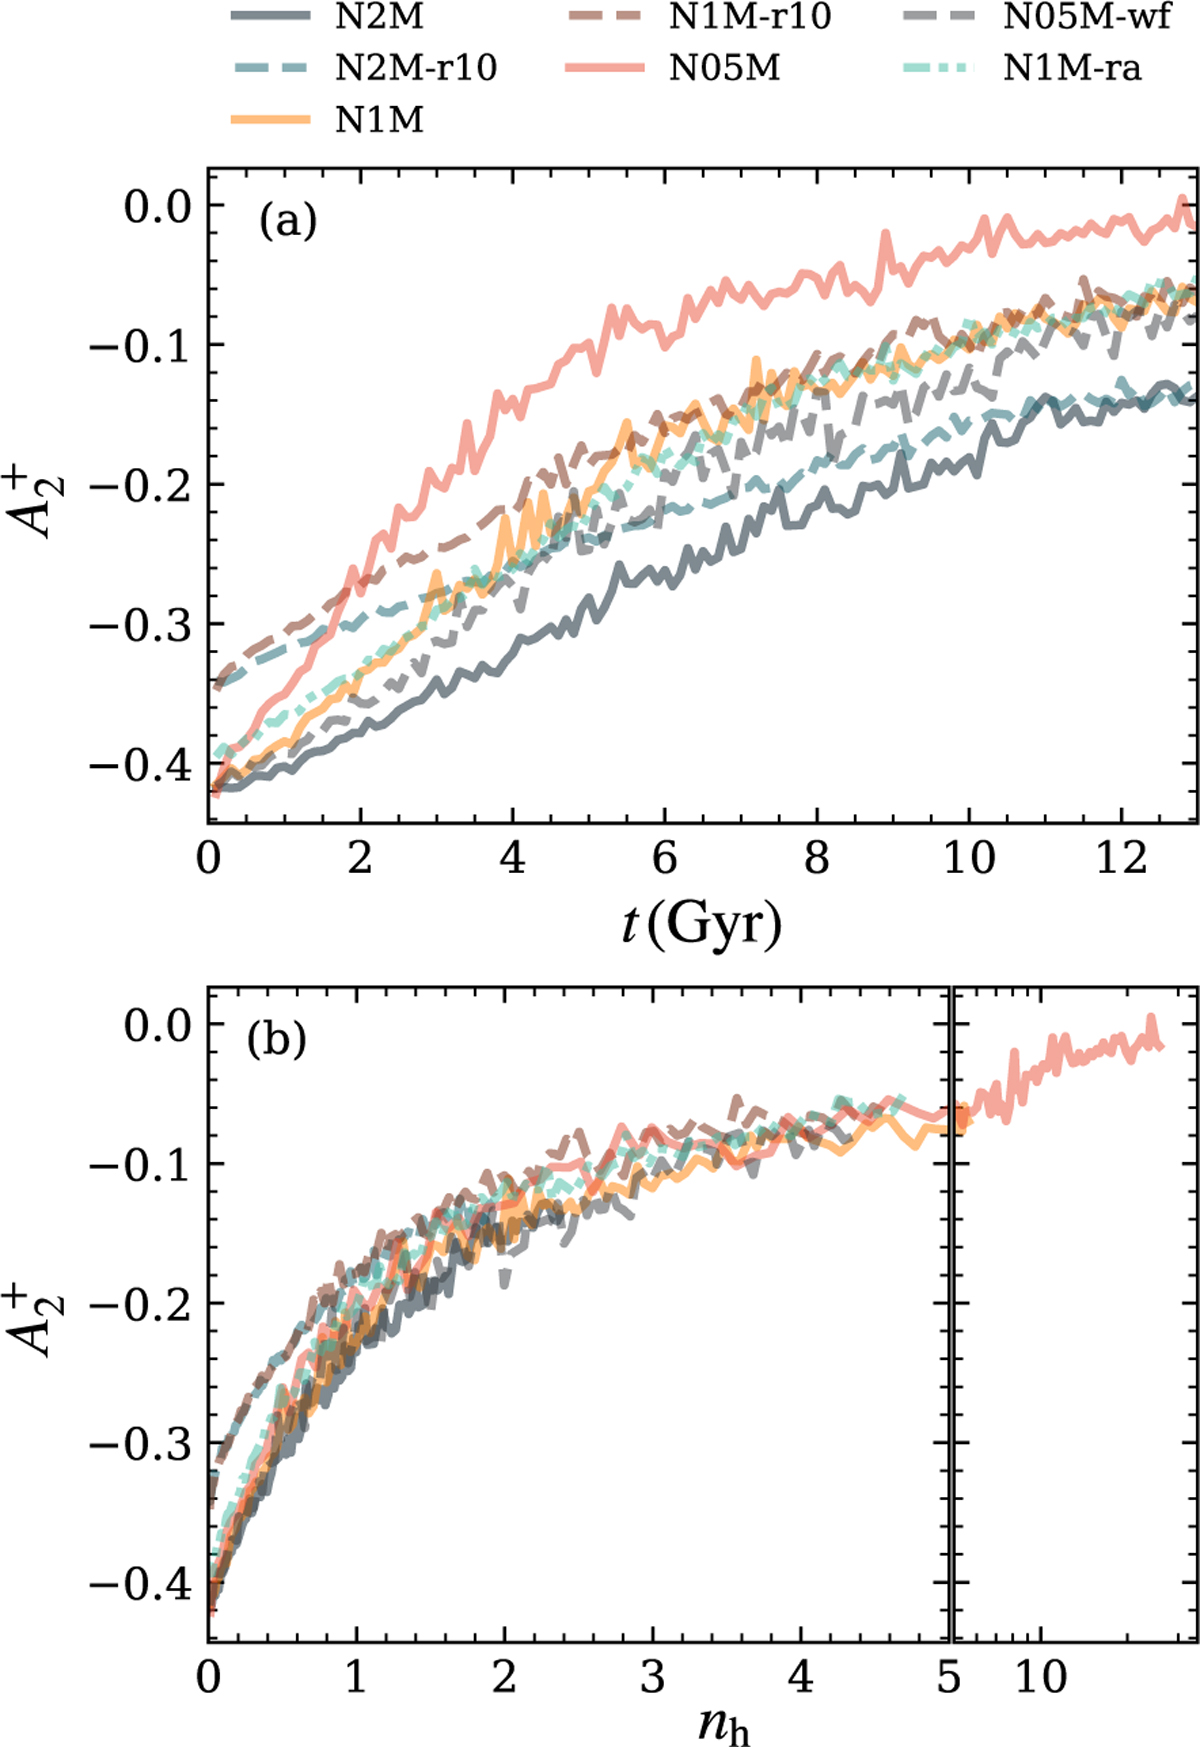
![]() Parameter evolution for all GCs as a function of time (a) and number of relaxation times (b). All models follow a similar evolutionary path as the two populations spatially mix. The panel a scatter reduces when we trace the cluster dynamical ages. After one relaxation time, the initial difference between the rh ratio of 20 (N2M, N1M, N1M-ra, N05M, and N05M-wf) and rh ratio of 10 models (N2M-r10 and N1M-r10) is indistinguishable.
Parameter evolution for all GCs as a function of time (a) and number of relaxation times (b). All models follow a similar evolutionary path as the two populations spatially mix. The panel a scatter reduces when we trace the cluster dynamical ages. After one relaxation time, the initial difference between the rh ratio of 20 (N2M, N1M, N1M-ra, N05M, and N05M-wf) and rh ratio of 10 models (N2M-r10 and N1M-r10) is indistinguishable.
Current usage metrics show cumulative count of Article Views (full-text article views including HTML views, PDF and ePub downloads, according to the available data) and Abstracts Views on Vision4Press platform.
Data correspond to usage on the plateform after 2015. The current usage metrics is available 48-96 hours after online publication and is updated daily on week days.
Initial download of the metrics may take a while.