Fig. 3
Download original image
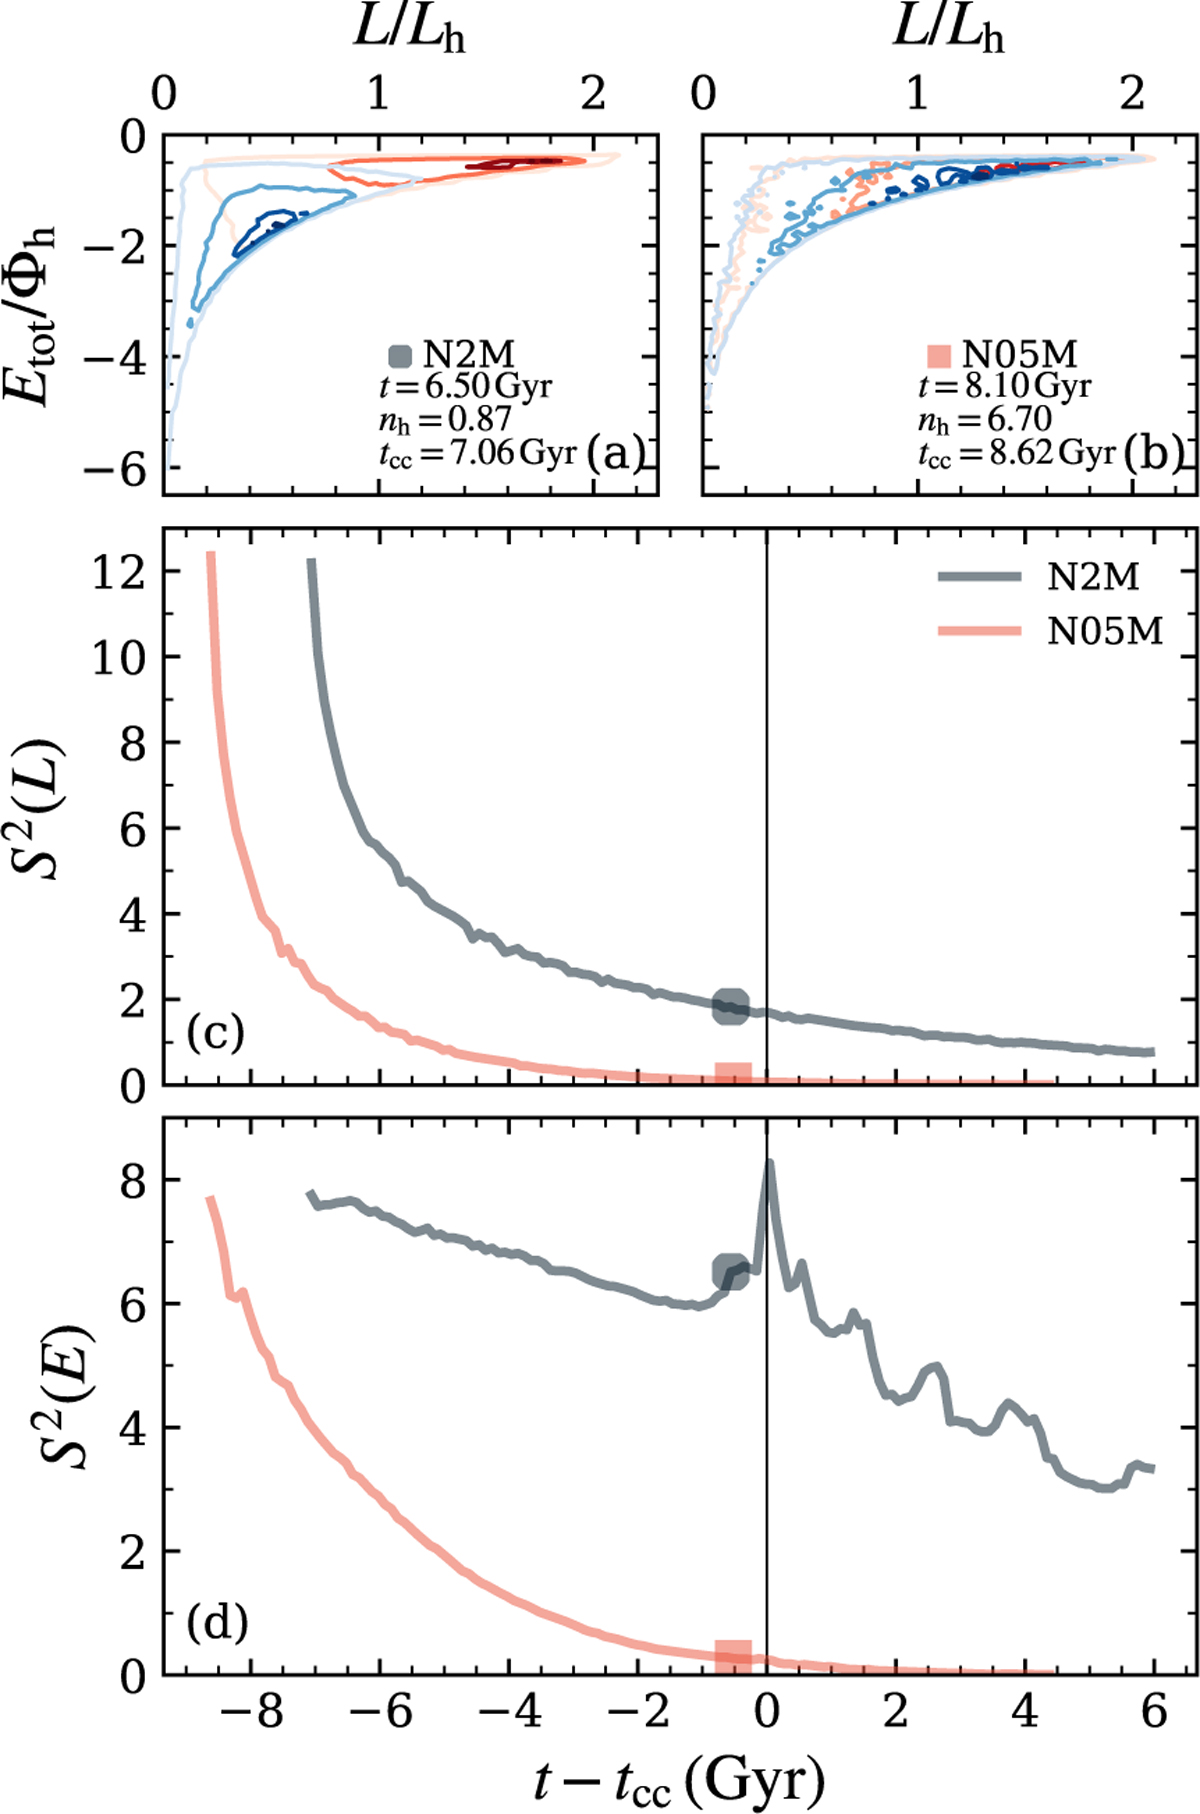
Effects of partial mixing during core collapse. Panels a and b: phase-space distribution of the models N2M and N05M at ~500 Myr before core collapse. The N2M model is far from fully mixed, while the N05M model has a significant degree of mixing. Panel c: evolution of the S2 parameter centred at the time of core collapse for the models N2M and N05M (tcc = 7.06 Gyr and tcc = 8.62 Gyr). The markers indicate the corresponding time of phase-space distributions in panels a and b. Paneld shows the value of the S2 parameter only for the energy component of the phase space. The peaks in S2(E) show the effects of core collapse and subsequent core oscillations for the model N2M, where the 2P dominates the inner regions. While for N05M model, the two populations are almost completely mixed at the time of core collapse, and the evolution of S2(E) does not show any feature associated with the core collapse.
Current usage metrics show cumulative count of Article Views (full-text article views including HTML views, PDF and ePub downloads, according to the available data) and Abstracts Views on Vision4Press platform.
Data correspond to usage on the plateform after 2015. The current usage metrics is available 48-96 hours after online publication and is updated daily on week days.
Initial download of the metrics may take a while.